
Figures & data
Figure 1. MBNL1-AS1 expression was remarkably downregulated in PCa tissues and cell lines. (a) The StarBase v3.0 project was used to analyze the level of MBNL1-AS1 in PCa tumor samples and normal samples. ***P < 0.001 vs. normal. (b) MBNL1-AS1 expression in several human PCa cell lines (LAPC4, LNCaP, DU145 and C4-2B) and the normal prostate epithelial cell line RWPE-1 was determined with RT-qPCR. ***P < 0.001 vs. RWPE-1
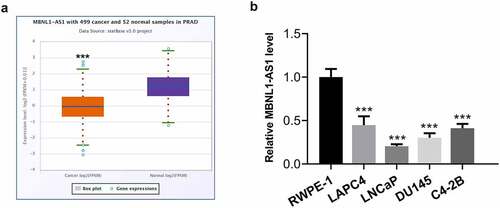
Figure 2. MBNL1-AS1 overexpression suppressed the proliferation, invasion and migration of LNCaP cells. (a) The expression of MBNL1-AS1 was examined using RT-qPCR after transfection with MBNL1-AS1 plasmid. ***P < 0.001 vs. pcDNA3.1. (b) Cell viability was evaluated by a CCK-8 kit. (c-d) The capacity of cell proliferation was assessed by means of colony formation assay. (e-f) Invasive activity of LNCaP cells was determined with Transwell assay. Magnification, x100. (g-h) Representative images and relative quantification of cell migration, as detected by a wound healing assay. Magnification, x100. **P < 0.01, ***P < 0.001 vs. pcDNA3.1
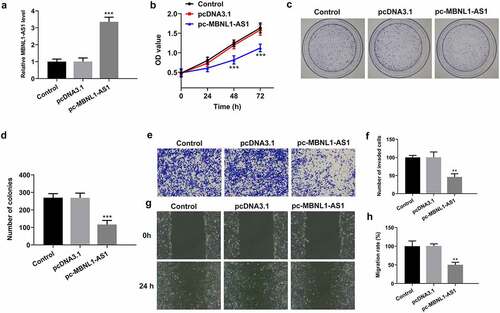
Figure 3. MBNL1-AS1 may bind to miR-181a-5p. (a) Potential binding sites of MBNL1-AS1 and miR-181a-5p. (b) The expression of miR-181a-5p was tested with RT-qPCR after transfection with miR-181a-5p mimic. ***P < 0.001 vs. miR-NC. (c) A luciferase activity reporter assay was conducted to verify the binding between MBNL1-AS1 and miR-181a-5p. ***P < 0.001 vs. miR-NC. (d) MiR-181a-5p level in PCa cancer samples and normal samples obtained from StarBase v3.0 project. ***P < 0.001 vs. normal. (e) RT-qPCR was employed to determine the expression of miR-181a-5p in several human PCa cell lines (LAPC4, LNCaP, DU145 and C4-2B) and the normal prostate epithelial cell line RWPE-1. ***P < 0.001 vs. RWPE-1. (f) MiR-181a-5p expression in LNCaP cells was evaluated by means of RT-qPCR analysis. **P < 0.01 vs. pcDNA3.1
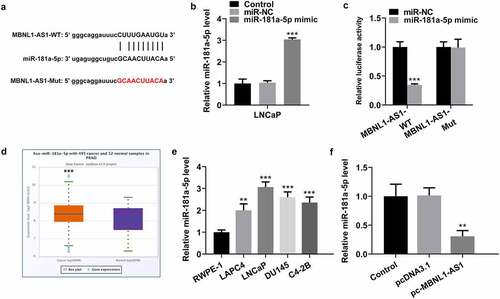
Figure 4. PTEN is a direct target of miR-181a-5p. (a) Potential binding sites of miR-181a-5p and PTEN. (b) Luciferase gene reporter assay displayed the activity when co-transfected with the PTEN-WT or Mut sequences and miR-181a-5p mimic or miR-NC. ***P < 0.001 vs. miR-NC. (c) RIP assay was used to verify the interaction between miR-181a-5p and PTEN. ***P < 0.001 vs. miR-NC. (d) RNA pull-down assay was employed to confirm the binding ability between miR-181a-5p and PTEN. ***P < 0.001 vs. NC probe. (e-f) Expression of PTEN was determined with RT-qPCR and western blot analysis after miR-181a-5p overexpression. (g-h) Western blotting was applied for the assessment of p-PI3K, p-AKT and p-mTOR following transfection with miR-181a-5p mimic. *P < 0.05, **P < 0.01 and ***P < 0.001 vs. miR-NC
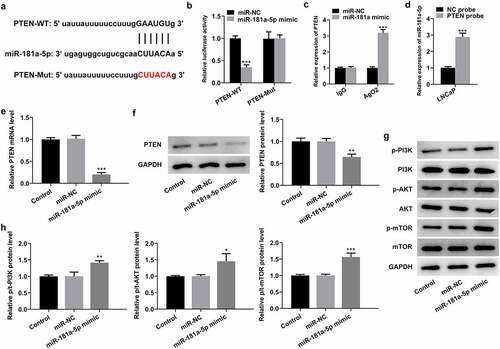
Figure 5. MiR-181a-5p mimic partially reversed the impact of MBNL1-AS1-upregulation on the proliferation, invasion and migration of LNCaP cells. (a) Cell viability was evaluated using CCK-8 assay. (b-c) Cell proliferation was detected by means of colony formation assay. (d-e) Transwell invasion assay was tested and the results were expressed as the number of invaded cells per field. (f-g) Wound scratch healing assay illustrated the migratory ability of LNCaP cells. ***P < 0.001 vs. pcDNA3.1; #P < 0.05, ##P < 0.01 and ###P < 0.001 vs. pc-MBNL1-AS1+ miR-NC
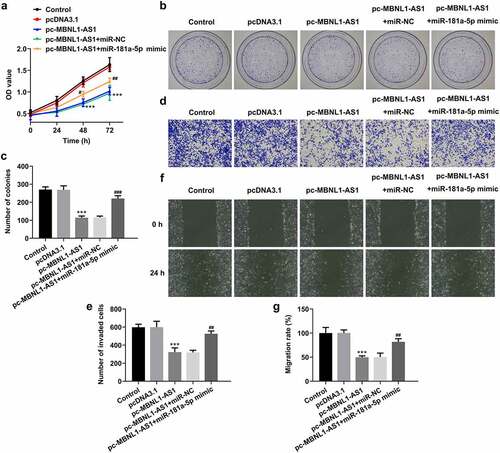
Figure 6. Upregulation of miR-181a-5p and MBNL1-AS1 attenuated PTEN expression and activates the PI3K/AKT/mTOR signaling pathway in LNCaP cells. The expression of PTEN, p-PI3K, p-AKT and p-mTOR was determined using western blot analysis. ***P < 0.001 vs. pcDNA3.1; #P < 0.05, ##P < 0.01 and ###P < 0.001 vs. pc-MBNL1-AS1+ miR-NC
Data availability statement
All data generated or analyzed during this study are included in this published article.