
Figures & data
Figure 1. SYNJ2 levels in different tissues and cell lines. (a) SYNJ2 levels in various cancer and non-cancerous tissues. The expression of liver HCC and non-HCC tissues were marked in the red box. The red dots and green dots, respectively, represent the expression of HCC and non-HCC samples. (b) Expression of SYNJ2 in liver-related tumorous cell lines. The box plot was marked in the red box
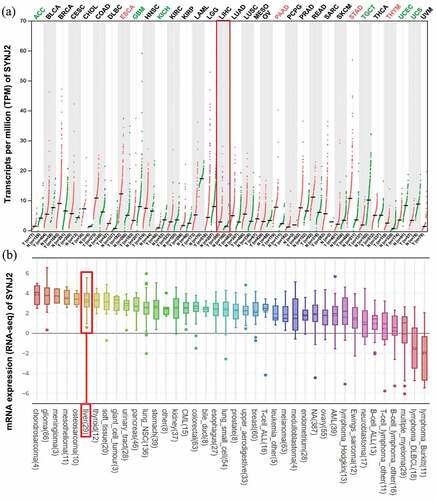
Table 1. Clinical and pathological parameters of SYNJ2 in HCCs
Figure 2. Levels and efficacy of SYNJ2 in clinical parameters. (a) Scatter plots and ROC curve of SYNJ2 in HCC and non-HCC tissues. (b) Scatter plots and ROC curve of SYNJ2 in male and female HCC patients. (c) Scatter plots and ROC curve of SYNJ2 in young (<60) and elder (≥60) HCC cases. (d) Scatter plots and ROC curve of SYNJ2 in G1-G2 and G3-G4 HCCs. (e) Scatter plots and ROC curve of SYNJ2 in T1-T2 and T3-T4 HCCs. (f) Overall survival status of HCCs with different SYNJ2 levels
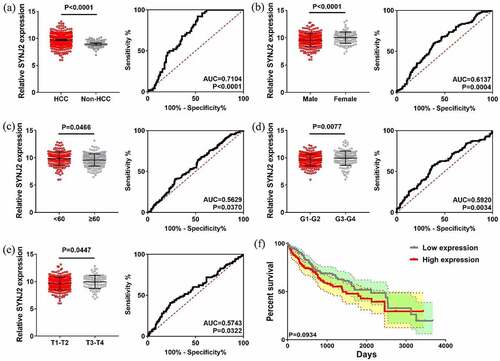
Figure 3. Visualization of multivariate Cox regression analyses and prognostic nomogram predicting. (a) Forest plot of hazard ratio showing the estimation of SYNJ2 expression and various clinicopathological parameters in HCC. (b) Nomogram predicting overall survival for significant clinicopathological parameters of HCC patients, including SYNJ2 level, gender, age, grade and T stage. (c, d) Calibration plots of the nomogram predictive performance of 1- and 5-year overall survival based on five variables (SYNJ2 level, gender, age, grade and T stage). The y-axis and x-axis separately represent actual and nomogram-predicted overall survival rate. The 45° gray line represents an ideal prediction and the black line means the nomogram-predicted performance
Table 2. Characteristics of the merged datasets
Figure 4. Levels and ROC diagrams of merged SYNJ2 expression data. Scatter plots and ROCs of merged SYNJ2 expression in (a) Affymetrix platform, (b) Illumina platform, (c) Agilent platform, (d) Rosetta platform, (e) Human-6k platform, (f) HiSeq×Ten platform, (g) ArrayStar platform, (h) GeneChip platform, (i) NimbleGen platform, and (j) TCGA-GTEx platforms
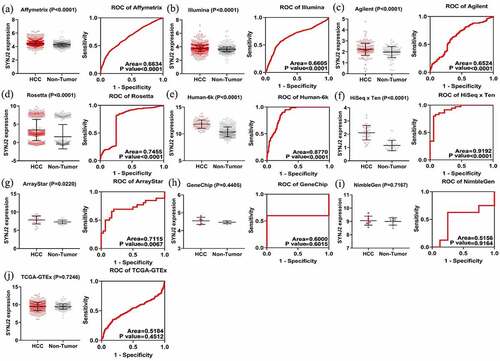
Figure 5. Results of SYNJ2 levels and diagnostic value. (a) Forest plots for SYNJ2 levels in HCC based on in-house IHC and different platforms. (b) SROC curve demonstrating performance of SYNJ2 in diagnosing HCC. (c) Pooled sensitivity and (d) specificity forest plots of SYNJ2
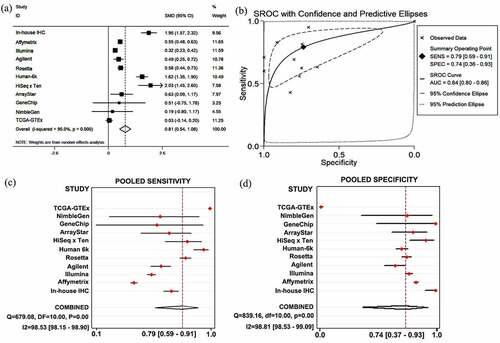
Figure 6. Alterations and overall survival status of SYNJ2 in HCC. (a) Diagnostic age, gender, and SYNJ2 altered types of HCC patients. (b) Difference of overall survival rates between SYNJ2 altered and unaltered groups
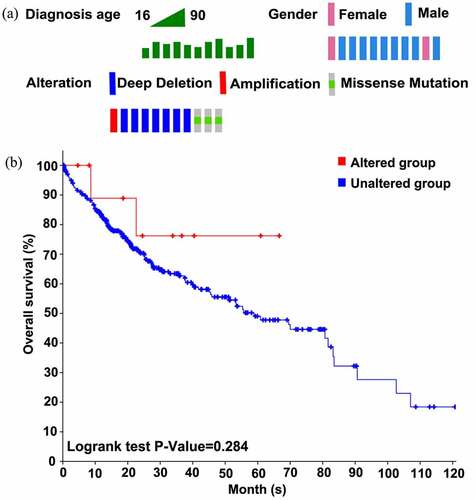
Table 3. Top 10 significant Kyoto Encyclopedia of Genes and Genome pathways of SYNJ2 and differentially coexpressed genes
Figure 7. Enrichment analysis of differentially coexpressed genes of SYNJ2. (a) Venn diagram of coexpressed genes and differentially expressed genes. (b) Bar plots of biological process, (c) cell component, and (d) molecular function. (e) KEGG pathways of co-functioned SYNJ2 and differentially coexpressed genes. X axis represents the counts of involved genes and Y axis means enriched annotations and pathways
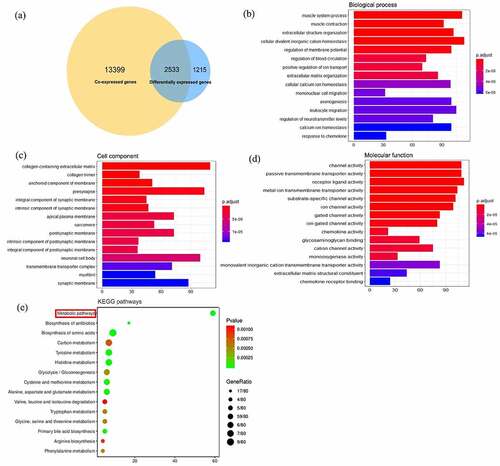
Figure 8. Diverse interactions of proteins. (a) Protein–protein interaction networks of metabolism-related differentially coexpressed genes. Each node means a gene and the bigger node size represents the higher interaction degree. The brighter node color represents the higher clustering coefficient. (b) Highly interconnected protein complexes
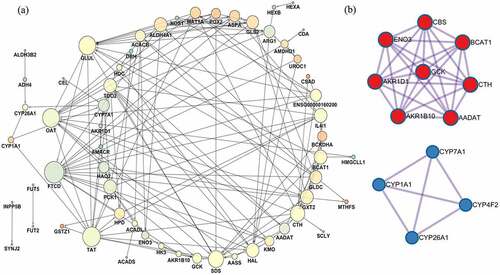
Figure 9. Correlations of metabolism pathways related differentially coexpressed genes based on CCLE
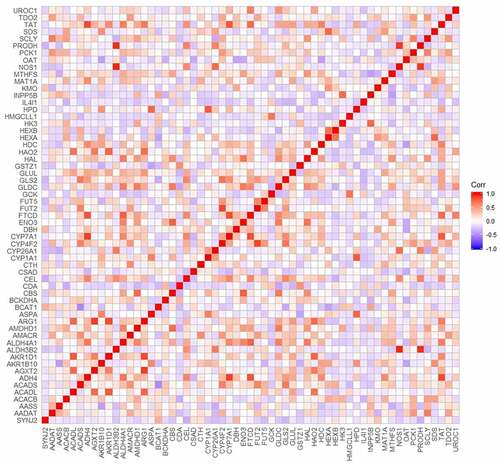
Table 4. Validated TF-target relationships of SYNJ2 and INPP5B in liver
Table 5. Genetic diseases related to transcription factors of SYNJ2 and INPP5B
Figure 10. Representative images of SYNJ2 protein expression. Negative SYNJ2 IHC staining in normal liver (a, b) and tumor adjacent liver tissues (c, d). Positive diffused staining of SYNJ2 in HCC cells (e, f). The original images were magnified 400 times
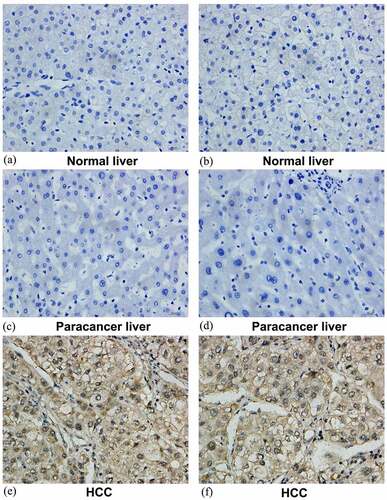
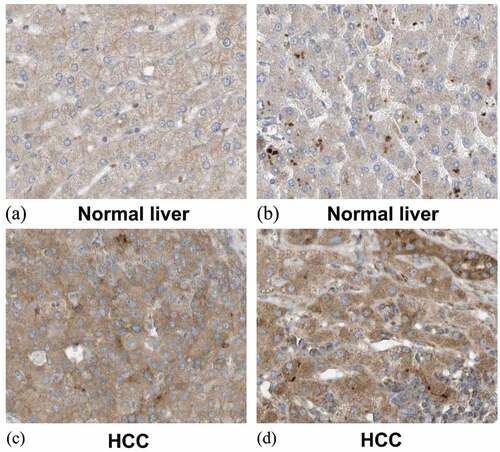
Figure 11. Expression of SYNJ2 in normal liver and HCC from the Human Protein Atlas database. (a, b) Low diffused staining of SYNJ2 in cytoplasmic and membranous of hepatocytes from samples 3402 and 2429. (c, d) Diffusedly brown medium staining of SYNJ2 in HCC tissues from patient 3196. The original images were magnified 400 times
Data availability
The data used to support the findings during the current study are available from the corresponding author upon reasonable request.