Figures & data
Table 1. Primers for miR-484 and reference genes
Figure 1. The expression level of miR-484 was down-regulated in neurons following oxygen-glucose deprivation (OGD). The mRNA expression levels of miR-484 were detected in OGD treated neurons. Data were presented as the mean ± SD with three independent experiments. **p < 0.01
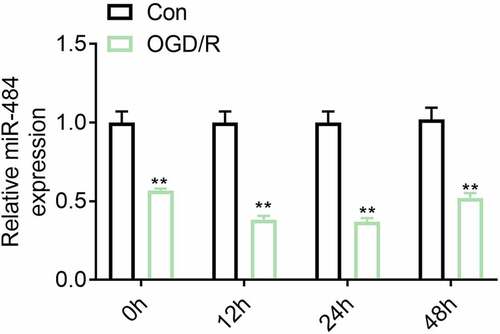
Figure 2. MiR-484 increased viability and inhibited apoptosis of neurons following oxygen-glucose deprivation (OGD). (a) CCK8 assay was applied to determine cell viability for each group, including OGD treated group, OGD treated + miR-484 inhibitor group, OGD treated + NC inhibitor group, OGD treated + miR-484 mimics group, and OGD treated + NC mimics group. (b) Western blot was applied to detect cell apoptosis-related proteins for each group. (c) Flow cytometry analysis was applied to detect apoptosis for each group. Data were presented as the mean ± SD with three independent experiments. **p < 0.01 versus control group, #p < 0.05 and ##p < 0.01 versus OGD treated + NC inhibitor group, and &p < 0.01 and &&p < 0.01 versus OGD treated + NC mimics group
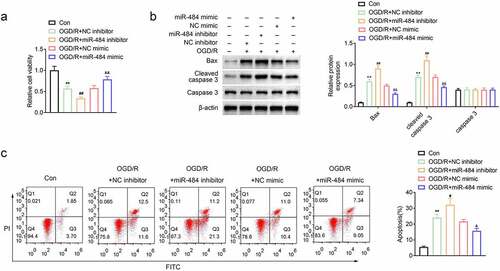
Figure 3. MiR-484 directly regulated BCL2L13 expression by binding to the 3ʹ-UTR of BCL2L13. (a) Forecast of miR-484 binding sites on target gene BCL2L13 by TargetScan. (b) Dual-luciferase assays were carried out after cells were co-transfected BCL2L13-WT or BCL2L13-MUT with miR-484 inhibitor, NC inhibitor (control), miR-484 mimics, and NC mimics (control), respectively. (c) The protein expression levels of BCL2L13 in cells were determined by western blot. β-actin was applied as the endogenous reference genes. Data were presented as the mean ± SD with three independent experiments. **p < 0.01 versus control group, ##p < 0.01 versus OGD treated + NC inhibitor group, and &&p < 0.01 versus OGD treateda + NC mimics group
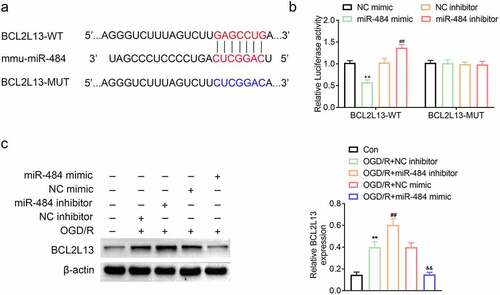
Figure 4. Overexpression of BCL2L13 reversed the effect of miR-484 in neurons following oxygen-glucose deprivation (OGD). (a) CCK8 assay was applied to determine cell viability for each group, including OGD treated + NC mimics + vector group, OGD treated + miR-484 mimics + vector group, OGD treated + NC mimics + BCL2L13 group, and OGD treated + miR-484 mimics + BCL2L13 group. (b)Western blot was applied to detect cell apoptosis-related proteins for each group. (c) Flow cytometry analysis was applied to detect apoptosis for each group. Data were presented as the mean ± SD with three independent experiments. *p < 0.05 and **p < 0.01 versus control group and #p < 0.05 and ##p < 0.01 versus OGD treated + miR-484 mimics + vector group
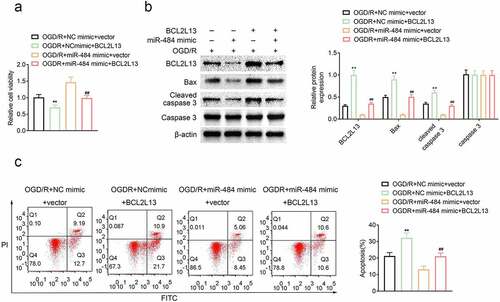
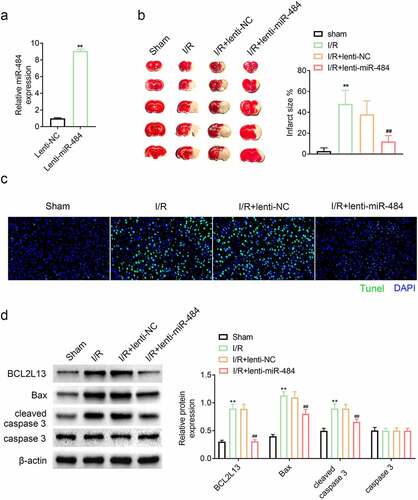
Figure 5. Overexpression of miR-484 alleviated cerebral ischemia/reperfusion injury in mice. (a) qPCR was applied to determine miR-484 expression level for each group, including lentiviral miR-484 and lentiviral NC vectors group. (b) Cerebral infarction volume was assessed to check protective effect of miR-484 on cerebral ischemia/reperfusion injury for each group. (c) Tunel assay was applied to determine cell apoptosis for each group. (d) Western blot was applied to detect cell apoptosis-related proteins for each group. **p < 0.01 versus sham-operated group and ##p < 0.01 versus lentiviral NC group