Figures & data
Table 1. Grain size of samples calculated via the Scherrer equation from diffraction data
Figure 1. XRD Pattern of pure phase and silver substituted strontium phosphate silicate samples sintered at 800°C
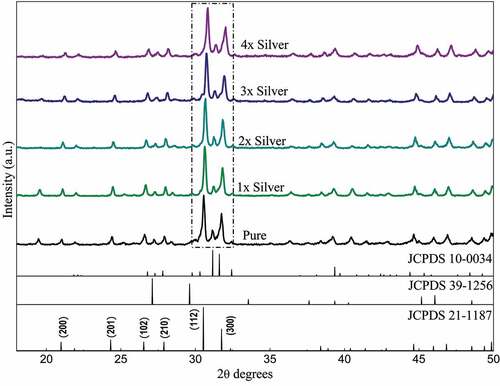
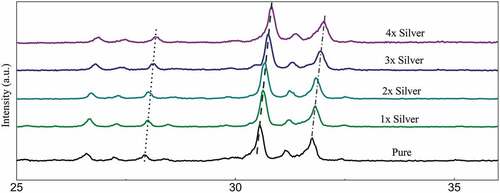
Figure 1a: Relative peak shift in diffraction data recorded with substitution of silver in samples sintered at 800°C
Figure 2: FTIR spectra of pure phase and silver substituted samples sintered at 800°C showing characteristic peaks and bands
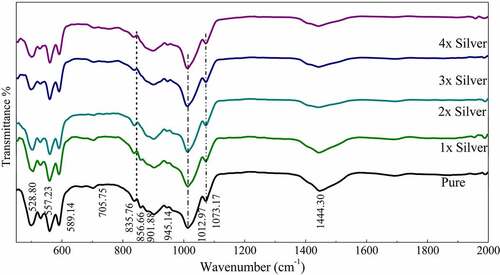
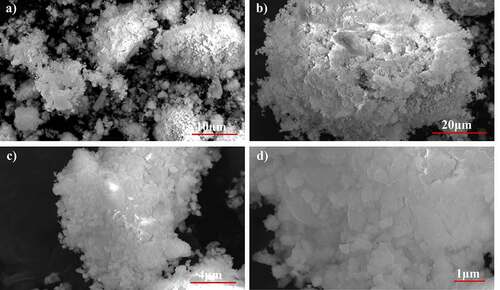
Figure 3. SEM Micrographs of (a) pure Phase and (b) silver substituted samples
Table 2. Absorbance and hemolytic ratio of pure phase and silver substituted samples calculated with respect to OD values
Figure 4. Optical photographs of the pure phase samples by hemolytic assay
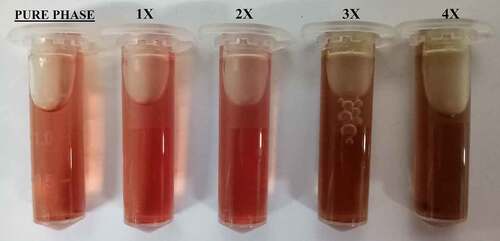
Figure 5a: a) Antibacterial effect generated by silver substituted samples over S. aureus calculated via CFU. b) Antibacterial effect generated by silver substituted samples over E. Ccoli calculated via CFU
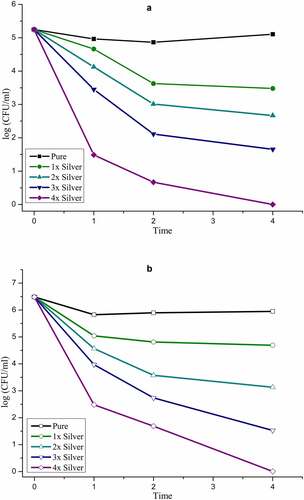
Figure 6. Relative cellular density as observed for different release concentrations of pure phase and silver substituted samples with respect to control
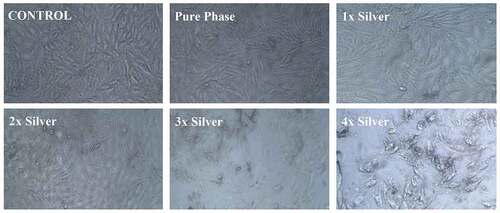
Figure 7. Calculated cell viability as observed for different release concentrations of pure phase and silver substituted samples with respect to control
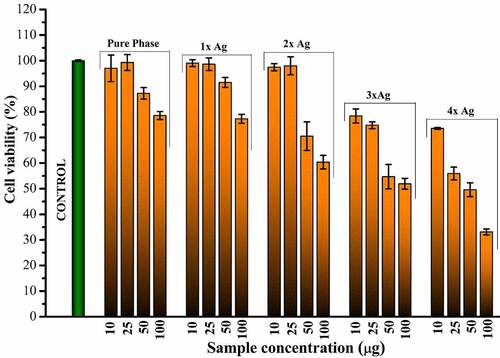
Figure 8. X-ray diffraction pattern of 2x silver substituted samples after simulated body fluid immersion
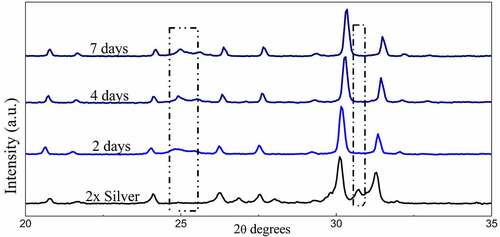
Figure 9. FT-IR Spectra of 2x silver substituted samples after simulated body fluid immersion
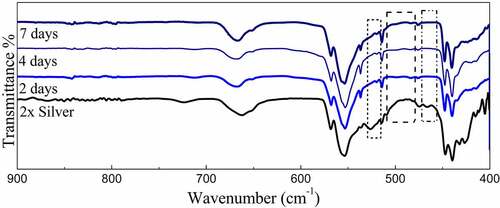
Figure 10. SEM Micrographs of 2x silver substituted samples after simulated body fluid immersion. after 7 days of immersion