Figures & data
Figure 1. Experimental setup used to determine the growth curve of three different seeding densities: 10,000 cells/cm2 (10 K); 20,000 cells/cm2 (20 K) and 30,000 cells/cm2 (30 K). n = 3 for each condition
Table 1. Details of the different experimental culture routes investigated in experiment B: the effect of feeding regimes. The Control route was subjected to daily medium exchanges; Route 1 was subjected to a medium exchange on day one only; Route 2 underwent a medium exchange on day 2; Route 3 cells had no medium exchange. n = 3 for each condition was used. M. Ex = medium exchange
Table 2. Details of the two conditions used to investigate density and nutrient availability-based growth inhibition. Cells cultured following the Daily Feed (DF) route underwent medium exchange every 24 h; cells cultured under the one feed (OF) route underwent a single medium exchange following the first 24 h culture Sacrificial wells were harvested and counted daily: n= 3 for each condition was used. M. Ex = medium exchange; DF = daily feed; OF = one feed
Figure 2. Analysis of H9 human embryonic stem cells (hESCs) growth dynamics and median fluorescence intensity (MedFI) values for OCT3/4, Ki67 and PAX6 markers for cells seeded at three different densities. (a) Specific growth rate (SGR) increased from negative SGR to positive SGR from day two to day four for all three densities. (b) Cell number decreased from day 0 to day two and then increased from day two four, the 10,000 cell/cm2 density did not have a significant increase in cell number during the four-day culture period. (c) All three densities had a decrease in cell viability from day 0 to day two which increased from day two four. OCT3/4 (d) and Ki67(f) were both highly expressed. (e) PAX6 expression levels were lower in comparison to OCT3/4 and Ki67. Error bars indicate standard deviation, n = 3. ‘*’ indicates p < 0.05, ‘**’ indicates p < 0.01, ‘***’ indicates p < 0.001, and ‘****’ indicates p < 0.0001
Figure 3. Analysis of H9 human embryonic stem cells (hESCs) growth dynamics for cells cultured under four different feeding regime routes. (a) Specific growth rate (SGR) decreased from passage 1 to 2 for the control and route 1 conditions, no significant difference was observed for route 2, while route 3 significantly increased from passage 1 to 2. (b) The same trend observed in the SGR was observed with the cell number yields from passage 1 to 2, i.e., only route 2 did not have a significant change in cell number between the two passages. (c) The control, route 1 and route 2 all had a decrease in cell viability from passage 1 to passage 2, which was not observed for route 3. Ki67 (d) and Oct2/4 (f) were both highly expressed in all the conditions. Pax6 median fluorescence intensity (MedFI) expression levels were very low in comparison to Oct3/4 and Ki67, inset shows the very low levels of Pax6 (3E), all conditions were under 1,500 for their MedFI values. Error bars indicate standard deviation, n = 3. ‘*’ indicates p < 0.05, ‘**’ indicates p < 0.01, ‘***’ indicates p < 0.001, and ‘****’ indicates p < 0.0001. Uns = unstained; Iso = isotype; D0 = cells at day 0; R1 = route 1; R2 = route 2; R3 = route 3
Figure 4. Growth dynamics of H9 cells with higher resolution cell count was carried out in the second run in Experiment B: the effect of feeding regimes. (a) Overall, the specific growth rate (SGR) was lower at passage 1, with all four conditions having negative SGRs until day three of passage 1. (d) At passage 2, route 2 and route 3 had a positive SGR from day one onwards, only route 3 had a significant decrease in SGR by day three of passage 2. At both passages the cell number increased from day 0 to day three, however at passage 1 (b) there was a decrease in cell number from day 0 to 1, not observed at passage 2 (e). Generally, cell viability increased throughout passage 1, except for route 1 which had a decrease on day two (c). At passage 2, route 2 and route 3 had variable cell viabilities from day to day, while the control and route 1 had increased cell viabilities from day to day (f). Error bars indicate standard deviation, n = 3.
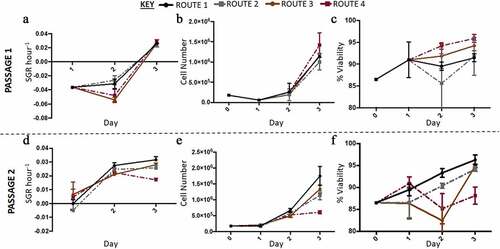
Figure 5. Lactate and lactate dehydrogenase (LDH) specific metabolic rate (SMR) data with higher resolution metabolite sampling was carried out in the second run in Experiment B: the effect of feeding regimes. Lactate SMR increased from passage 1 (a) to passage 2 (c), at passage 2 lactate SMR decreased for all routes except route 3. LDH SMR was highest for route 3 at passage 1 (b) and passage 2 (e), generally LDH SMR decreased for all routes except route 3 at passage 2. Glucose SMR of consumption was highest at day one passage 1 for all conditions, except route 3, passage 1 (C) and passage 2 (f). Error bars indicate standard deviation, n = 3.
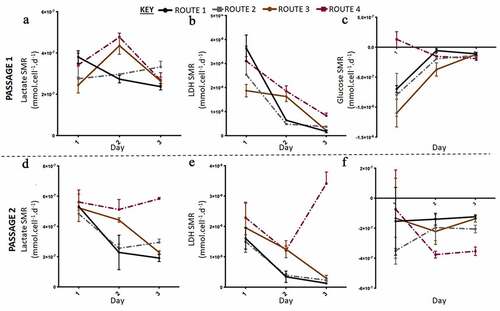
Figure 6. Growth dynamics. (a) Specific growth rate (SGR) increased from negative SGR to positive SGR from day three onwards peaking at day four for the daily feed (DF) condition and day three for the one feed (OF) condition. OF had a greater decrease in SGR over the seven-day culture period, SGR differed between the two conditions on day one (p = 0.0012). (b) Cell number decreased from day five onwards for both conditions, similar to the SGR OF has the most notable decrease in cell number and cell viability (c). From day four onwards there was a significant difference in cell number yield between the two conditions: day 4 (p < 0.0001); day 5 (p = 0.0002); day 6 (p < 0.0001); day seven (p < 0.0001). Error bars indicate standard deviation, n = 6. Lactate SMR decreased throughout the passage for daily feed (DF), one feed (OF) decreased until day five to six when it increased significantly (p = 0.0079) (d). Lactose dehydrogenase (LDH) specific metabolite rate (SMR) was highest from day five to six for the OF condition, the DF condition had low levels of LDH production over the seven-day culture period (e). Significant differences in SMR between the two conditions for both lactate and LDH were observed at day six (p < 0.0001) and day seven (p < 0.0001). Glucose SMR was high at day one for the DF condition after which it significantly decreased from day two onwards and plateaued (f). Error bars indicate standard deviation, n = 3
Figure 7. Ki67 and PAX6 and OCT3/4 median fluorescence intensity (MedFI) values. Ki67(a) and OCT3/4 (c) were both highly expressed in both conditions. (b) PAX6 expression levels were lower in comparison to OCT3/4 and Ki67, inset shows the very low levels of PAX6, all conditions were under 800 for their MedFI values. Ki67 and OCT3/4 decreased from day six to seven, resulting in lower expression level overall when compared to the control (day 0) and both conditions at day seven