Figures & data
Figure 1. Sample clustering and differentially expressed genes (DEGs) between osteoarthritic (OA) and normal samples. (a) principal component analysis (PCA) plot of samples after removing batch effect. PC1: the first principal component; PC2: the second principal component. (b) heat map for DEGs. The top 20 upregulated or downregulated DEGs ranked by adjusted p values are displayed
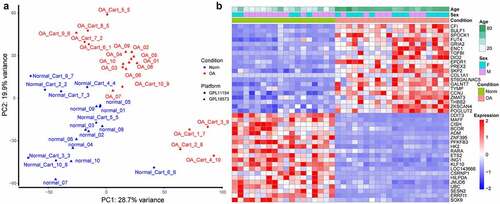
Figure 2. Cluster dendrograms and correlation heat maps. (a) cluster dendrogram of samples and trait heat map. White denotes low and red denotes high. In terms of the sex trait, 0 indicates female, and 1 indicates male. For the OA trait, 0 denotes normal and 1 denotes OA. (b) Cluster dendrogram of genes and gene-trait correlation heat map. The different colors on the left side of the heat map represent different gene co-expression module. Blue denotes low and red denotes high for the correlation heat map. (c) Module-trait correlation heat map. The numbers outside the parentheses represent the correlation coefficient, and the numbers in parentheses represent the p-value. *: p < 0.05; **: p < 0.01; ***: p < 0.001
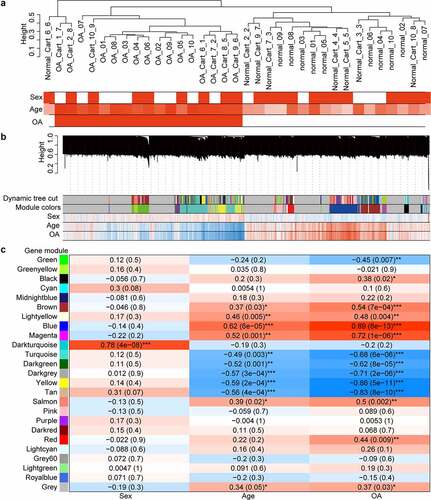
Figure 3. Gene expression along pseudotime and enriched pathways. (a) cell trajectories colored by pseudotime. (b) modules of genes covarying across pseudotime
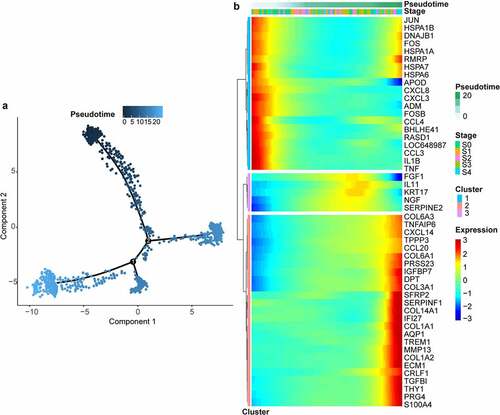
Figure 4. Intersection of genes obtained from different methods and enriched pathways. (a) intersection of differentially expressed genes (DEGs), gene modules having the strongest correlation with OA, and genes changing as a function of pseudotime. Positively correlated gene module: the gene module exhibiting the strongest positive correlation with OA. Negatively correlated gene module: the gene module exhibiting the strongest negative correlation with OA. Pseudotime DEGs: genes changing as a function of pseudotime. (b) top 10 upregulated gene ontology (GO) pathways ranked by q value. BP: biological process; CC: cellular component; MF: molecular function. (c) significant upregulated kyoto encyclopedia of genes and genomes (KEGG) pathways. (d)significant downregulated GO pathways. (e) significant downregulated KEGG pathways
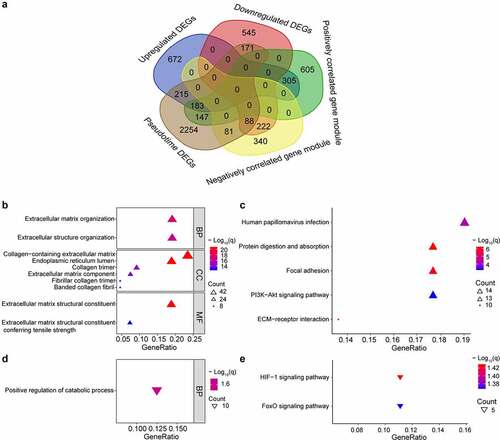
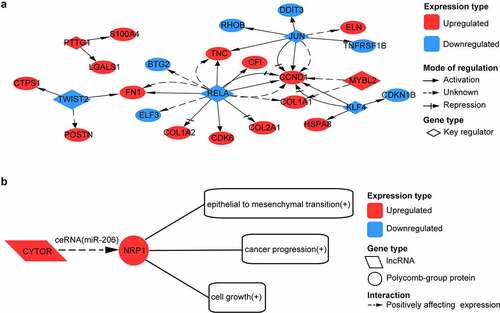
Figure 5. Analysis of transcription factor (TF) and long non-coding RNA (lncRNA) regulation for intersected genes. (a) network formed by six key transcription factors and their target genes. (b) possible long non-coding RNA (lncRNA) regulation in OA. CYTOR acts as competing endogenous RNA (ceRNA) to positively affect NRP1 expression by sponging with miR-206