Figures & data
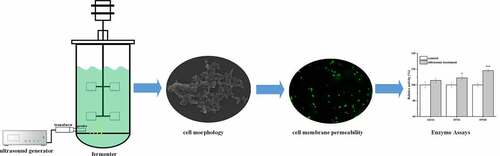
Figure 1. Effect of ultrasound treatment on the growth of C. glutamicum CP in different phases. (a): The growth curve of C. glutamicum CP; (b): biomass increase of C. glutamicum CP treated with ultrasound at different incubation times. Different letters indicate significant differences (P < 0.05)
Figure 2. Effects of ultrasound treatment parameters on the growth of C. glutamicum CP. Biomass increase of C. glutamicum CP treated with the ultrasound at different power densities (a), frequencies (b), intervals (c), and durations (d). Letters indicate significant differences (P < 0.05)
Figure 3. Response surface plot for interactions between four independent variables affecting L-leucine production. The titer of L-leucine was observed as a response variable for the interaction of two independent variables. The other parameters were at central points. Two variables were plotted against each other in each panel
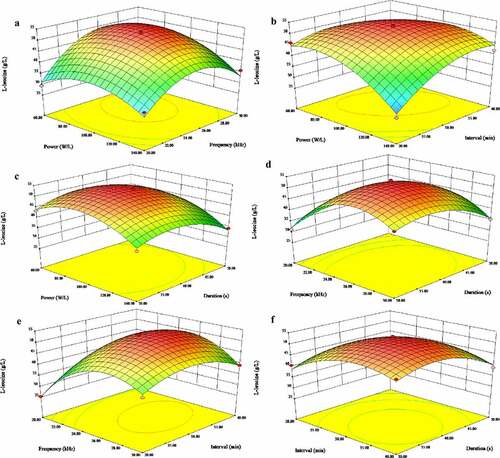
Figure 4. Time profiles of biomass (a), glucose (b), and L-leucine (c) concentrations in fed-batch fermentation of C. glutamicum CP with and without ultrasonic treatment. All fermentation experiments were performed in three independent replicates (n = 3)
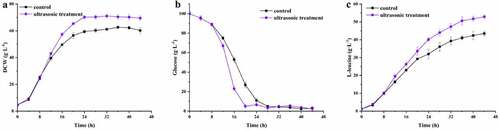
Figure 5. Electron microscopic observation of the cell morphology of C. glutamicum CP with/without ultrasonic treatment. (a–b): control cells; (c–d): ultrasound treated cells
Figure 6. Fluorescence microscopy of C. glutamicum CP cells with/without ultrasound treatment. The cells exhibiting green fluorescence have an intact membrane, while cells with a permeabilized membrane exhibit red fluorescence. (a–b): control cells; (c–d): ultrasound treated cells
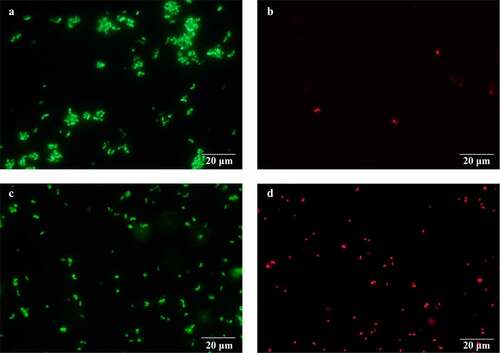
Figure 7. Relative activity of AHAS, IPMS, and IPMD in cells from the stationary phase with and without ultrasound treatment. The enzyme activities in the control were set 100%. The data represent the means ± standard deviations from three independent experiments. *P ≤ 0.05, **P ≤ 0.01, ***P ≤ 0.001。