Figures & data
Table 1. The characteristic of SSc patients and control cohorts
Table 2. Primers used in quantitative RT-PCR assay
Figure 1. Primary human skin fibroblast culture and characterization
(a) Morphological features of normal skin fibroblasts (NFBs) and SSc skin fibroblasts (SFBs) under conventional microscopy (magnification: 200×, scale bar: 100 μm). (b) Expression of cytokeratin (CK) and vimentin proteins in primary NFBs and SFBs. The protein expression in human skin fibroblasts was detected by immunocytochemistry using specific antibodies.
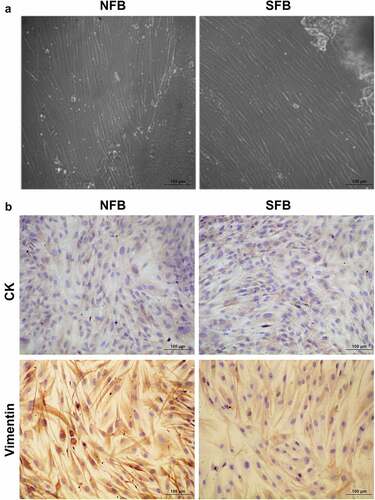
Figure 2. Downregulation of FLI1 expression in primary human skin fibroblast
(a) Relative FLI1 mRNA levels in NFBs and SFBs. The mRNA levels were measured by quantitative RT-PCR; glyceraldehyde-3-phosphate dehydrogenase (GAPDH) was used as an internal standard. (b) FLI1 protein abundance in NFBs and SFBs. FLI1 protein abundance was detected by western blotting; GAPDH was used as an internal standard. N = 3, ** P < 0.01.
Figure 3. Suppression of FLI1 expression by miR-26a in SFBs
(a) The association between miR-26a and 3'-UTR of the FLI1 gene was predicted by the miRNA.org software. (b) Relative miR-26a levels in NFBs and SFBs. MiRNA levels were analyzed by quantitative RT-PCR. (c) Relative miR-26a levels in SFBs transfected with miR-26a mimics and inhibitor. (d) Relative mRNA levels of FLI1, fibronectin, and collagen in SFBs transfected with miR-26a mimics and inhibitor. (e, f) Protein abundances of FLI1, fibronectin, and collagen in SFBs transfected with miR-26a mimics and inhibitor. Protein levels were determined by western blotting; GAPDH was used as the internal standard. N = 3, * P < 0.05; ** P < 0.01.
Figure 4. BSYJ suppresses SFB fibrosis via miR-26a-mediated FLI1 expression regulation
(a) Relative miR-26a levels in SFBs after treatment with astragaloside (AST), BSYJ-containing rat serum, miR-26a mimics or inhibitor. The miRNA levels were analyzed by quantitative RT-PCR. (b–d) Relative mRNA levels of FLI1 (b), collagen I (c), and fibronectin (d) in SFBs after treatment with AST, BSYJ-containing rat serum, miR-26a mimics and inhibitor by quantitative RT-PCR. (e) Abundance of fibronectin and collagen proteins in SFBs after treatment with AST, BSYJ-containing rat serum, miR-26a mimics, and inhibitor. Protein levels were analyzed by western blotting; GAPDH was used as the internal standard. N = 3, # and ## indicate P < 0.05 and P < 0.01, respectively, compared with NFBs; * and ** indicate P < 0.05 and P < 0.01, respectively, compared with SFBs.
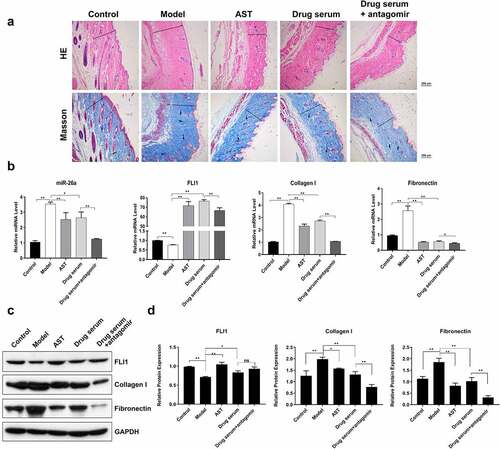
Figure 5. Enhanced anti-fibrosis effect of BSYJ by miR-26A suppression
(a) Collagen fiber deposition in SSc mice after treatment with a combination of BSYJ and antagomir. Masson’s trichrome staining was performed to evaluate fiber accumulation and fibrosis in mice skin. The transverse line indicates the thickness of dermis and the arrow indicates collagen signal (magnification: 100×, scale bar: 200 μm). (b) Relative mRNA levels of FLI1, fibronectin, and collagen I and miR-26a in SSc mice skin treated with a combination of BSYJ and antagomir. Relative expression was analyzed by quantitative RT-PCR. (c, d) Protein abundance of FLI1, collagen I and fibronectin in SSc mice skin treated with a combination of BSYJ and antagomir, analyzed by western blotting. GAPDH was applied as the internal standard. N = 3, * and ** indicate P < 0.05 and P < 0.01, respectively.