Figures & data
Table 1. Correlations between RBM25 expression with clinicopathologic features in 341 HCC patients
Figure 1. Elevated RBM25 predicated poor clinical outcome in HCC patients. Overall survival curve of high and low expression of RBM25 in (a) all HCC patients, (b) male patients, (c) N0 stage patients, (d) pathological stage I/II patients, (e) pathological stage III/IV patients, (f) T I/II stage patients, and (g) T III/IV stage patients
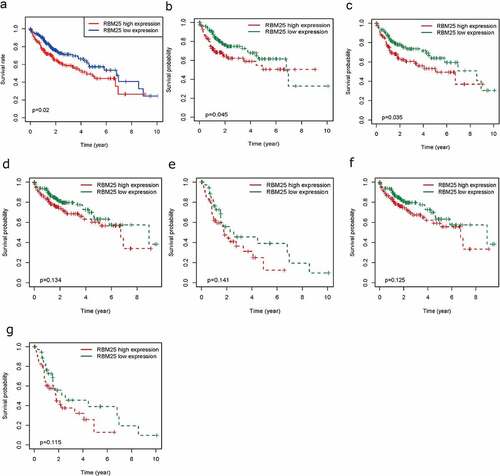
Figure 2. Identification of RBM25-related genes in HCC. (a) Comprehensive analysis of differential gene expression between normal tissues and tumor tissues. (b) RBM25-related genes with P< 0.05 were identified. A Volcano plot revealed the number of RBM25-related genes. (c and d) Z-scores of RBM25-positively-related genes (c) and -negatively-related genes (d) are displayed in a heatmap
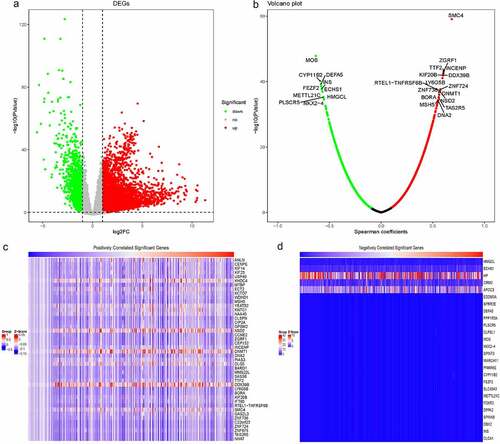
Figure 3. Weighted gene co-expression network analysis for RMB25-related genes. (a) The soft threshold power of β = 14 was considered to satisfy the distribution of a scale-free network. (b) A total of 33 modules with similar patterns were identified by merging similar modules. (c) The MEturquoise module had the highest Pearson coefficient with HCC (Cor = 0.8, P= 2e-91). (d) There were 694 genes from the MEturquoise module that were RBM25-related genes
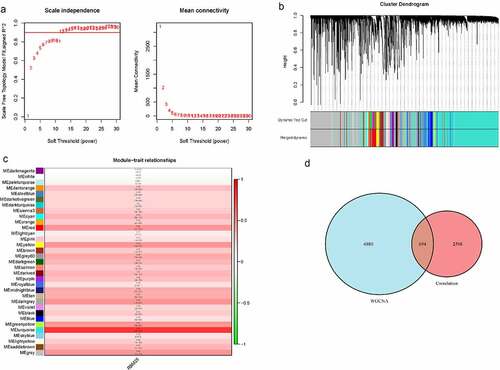
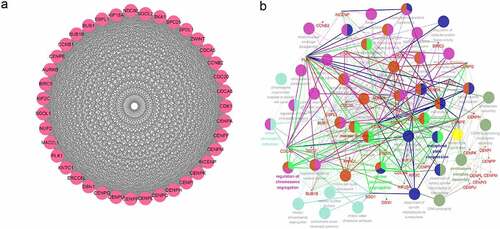
Figure 4. PPI and GO-BP analyses results. (a) PPI network analysis revealed 39 genes that were strongly positively correlated with RBM25. (b) GO-BP PPI interaction data for RBM25