Figures & data
Table 1. The primers used in this study for RT-PCR
Figure 1. The expression of SND1-IT1 in RB and its clinical significance. (a) SND1-IT1 expression in RB specimens and normal retina tissues was measured using RT-PCR. (b) ROC curves of SND1-IT1 expression for differentiating RB tissues from normal tissue. (c) Relative expression of SND1-IT1 in WERI-RB1, SO-RB50, Y79 and ARPE-19 cells. (d,e) Overall survival rate and disease-free survival rate were calculated using the Kaplan-Meier analysis. **p < 0.01, *p < 0.05
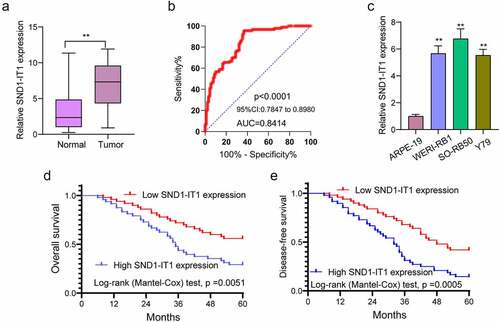
Table 2. Correlations between lncRNA SND1-IT1 and clinicopathological characteristics in retinoblastoma
Table 3. Multivariate analyses of prognostic factors in RB patients
Figure 2. SND1-IT1 promoted proliferation of RB cells. (a) qRT-PCR analysis of the effect on inhibition of si-SND1-IT1 transfection in WERI-RB1 and SO-RB50 cell lines. (b) Cell proliferation was determined by CCK-8 assays. (c) Clone formation assays was used to detect cell proliferation in RB cells. (d) EdU immunofluorescence staining assays for WERI-RB1 and SO-RB50 cells. **p < 0.01, *p < 0.05
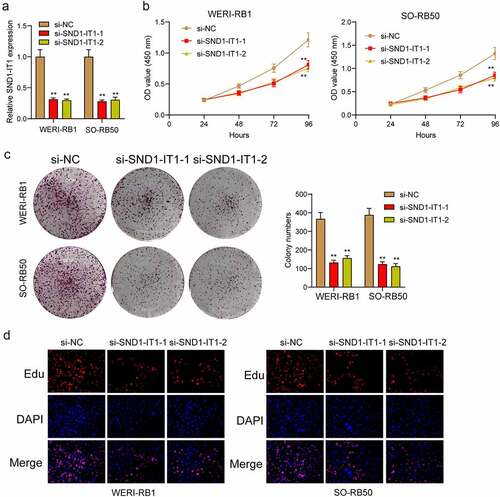
Figure 3. SND1-IT1 accelerated in vivo tumor growth. (a) The downregulation of SND1-IT1 expression in sh-SND1-IT1 transfected WERI-RB1 cells was confirmed by RT-PCR. (b) Tumors derived from mice in two different groups were presented. (c) Tumor volumes were detected every 7 days. (d) The subcutaneous tumor weights were detected at the 28th day after injection. **p < 0.01, *p < 0.05
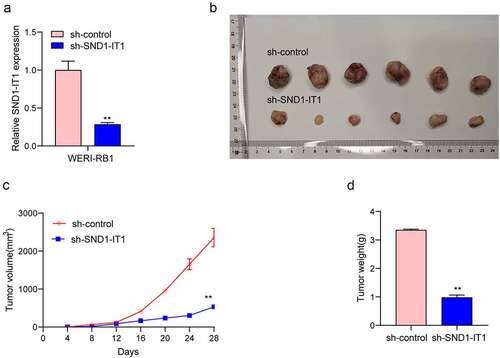
Figure 4. Knockdown of SND1-IT1 suppressed the metastasis of RB cells. (a) Wound healing assay was used to assess the migration of WERI-RB1 and SO-RB50 cells transfected with si-SND1-IT1-1, si-SND1-IT1-2 or si-NC, respectively. (b) The effect of SND1-IT1 on WERI-RB1 and SO-RB50 invasion was determined by transwell assays. (c) Knockdown of SND1-IT1 inhibited the EMT progress. **p < 0.01, *p < 0.05
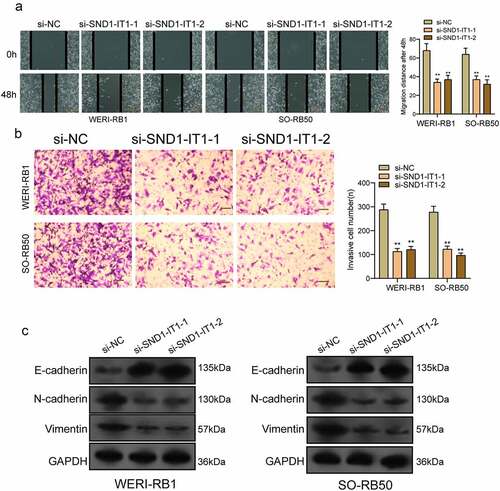
Figure 5. SND1-IT1 acts as a sponge for miR-132-3p. (a) Relative SND1-IT1 expression levels in nuclear and cytosolic fractions of WERI-RB1 and SO-RB50 cells. Nuclear controls: U6; Cytosolic controls: GAPDH. (b) The predicted binding sites of miR-132-3p to the SND1-IT1 sequence. (c) The levels of miR-132-3p in our cohort by RT-PCR. (d) SND1-IT1 expressions in three RB cell lines and ARPE-19 as determined by qRT-PCR. (e) The correlation between miR-132-3p and SND1-IT1 expression analyzed in 98 paired RB samples. (f) CCK-8 determined cell proliferation. (g) Transwell assay was used to detect cell invasion in WERI-RB1 and SO-RB50 cells after overexpression of miR-132-3p. (h) Detection of miR-132-3p using qRT-PCR in the sample pulled down by biotinylated SND1-IT1 probe. (i) Co-transfection of miR-132-3p and SND1-IT1-Wt strongly decreased the luciferase activity. (j,k) The regulatory effects between SND1-IT1 expression and miR-132-3p expression were determined by RT-PCR. **p < 0.01, *p < 0.05
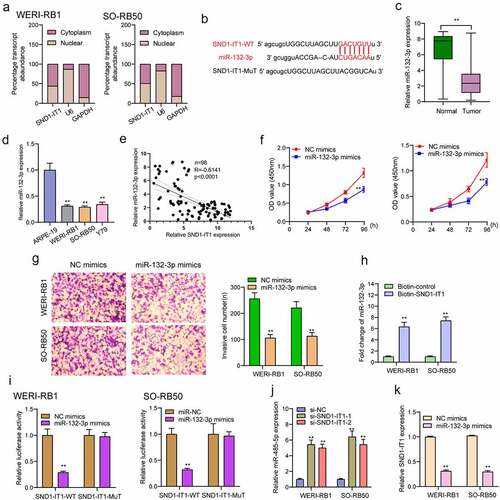
Figure 6. SMAD2 acted as a target of miR-132-3p. (a) The sequences of SMAD2 and miR-132-3p within SMAD2 3ʹ-UTR, including wild-type and mutant. (b) the mRNA and protein levels of SMAD2 were increased in RB cells. (c) Relative luciferase activity of WERI-RB1 and SO-RB50 cells after co-transfection with wild type (wt) or mutant (mut) SMAD2 3ʹ-UTR reporter genes and miR-132-3p mimics. (d) Overexpression of miR-132-3p suppressed the expression of SMAD2. **p < 0.01, *p < 0.05
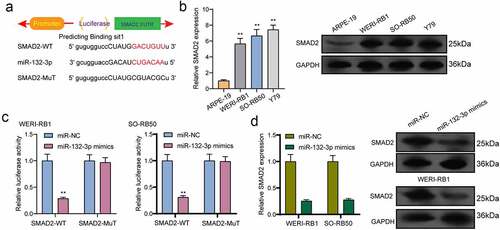
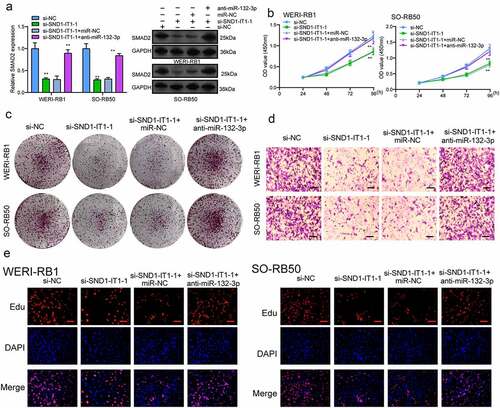
Figure 7. Knockdown of miR-132-3p attenuates the regulatory effects of SND1-IT1 knockdown on the progression of RB cells. (a) The expression levels of SMAD2 in WERI-RB1 and SO-RB50 cells after knockdown of SND1-IT1 and/or inhibition of miR-132-3p. The CCK-8 assays (b), colony formation assays (c), Cell invasion(d), Edu assays (e) following knockdown of SND1-IT1 and/or inhibition of miR-132-3p. *p < 0.05, **p < 0.01