Figures & data
Table 1. Characteristics of GEO datasets included in the study
Figure 1. Differentially expressed genes between the two groups of samples in each dataset. (a) GSE32867, (b) GSE46539, (c) GSE63459, (d) GSE75037, (e) GSE116959. Red and green dots stand for up-regulated and down-regulated genes, respectively, while black dots stand for insignificant genes
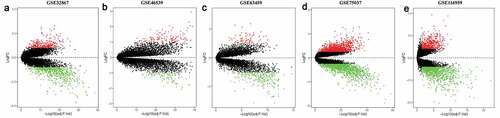
Figure 2. The RRA-based identification of potent DEGs. Heatmap showing the 20 most significantly up-regulated and down-regulated DEGs identified from the GEO series. The rows and columns stand for DEGs and datasets, respectively. The change in color from red to green indicated the change from up-regulation to down-regulation. Numbers within the box are the logarithmic FCs
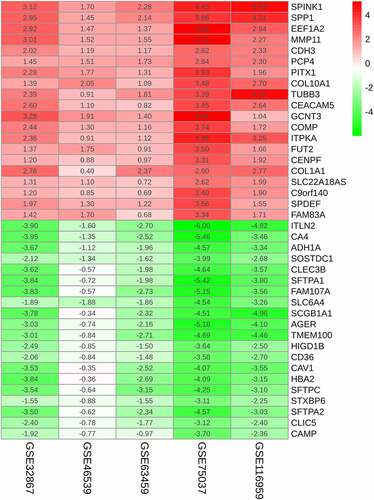
Figure 3. Enrichments of integrated DEGs are identified in the ontology categories. (a) Ten most significant BP terms. (b) Ten most significant CC terms. (c) Ten most significant MF terms. (d) Three most significantly enriched KEGG pathways. (e) The top 20 enriched DisGeNET terms. (f) The top 6 enriched PaGenBase terms. (g) The top 5 enriched TRRUST terms
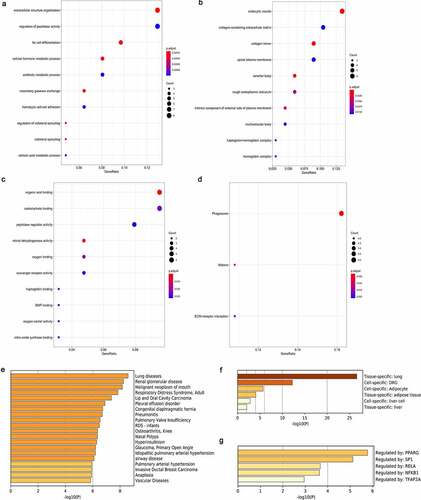
Figure 4. Construction of biomarkers with prognostic value. (a) Forest plot showing the eventual model established using the forward stepwise strategy. (b) Associations of the expression of biomarkers with survival for LUAD cases. (c) Nomogram for predicting 1-, 3-, and 5-year survival. (d) Calibration curve of the nomogram that predicted 3-year OS. (e) Calibration curve of the nomogram that predicted 5-year OS
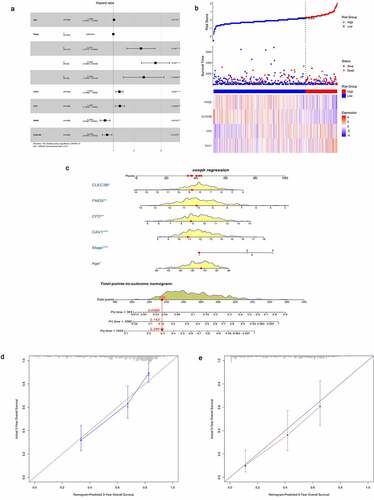
Figure 5. Biomarker validation. (a) Differential expression between tumor and matched non-carcinoma samples. (b) Expression in LUAD samples with different tumor stages. (c) Association between expression and overall survival time. (a) CAV1. (b) CFD. (c) CLEC3B. (d) FMO2
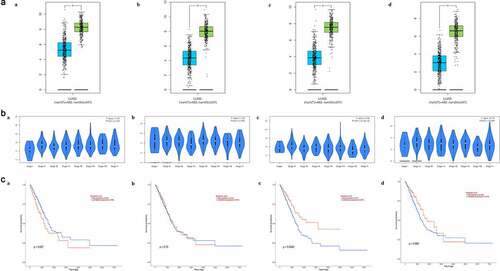
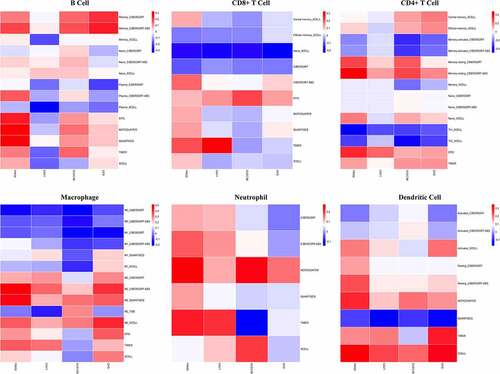
Figure 6. Relationship between the expression of biomarkers and immune infiltration degrees in LUAD. (a) CAV1. (b) CFD. (c) CLEC3B. (d) FMO2. P < 0.05 denotes significance
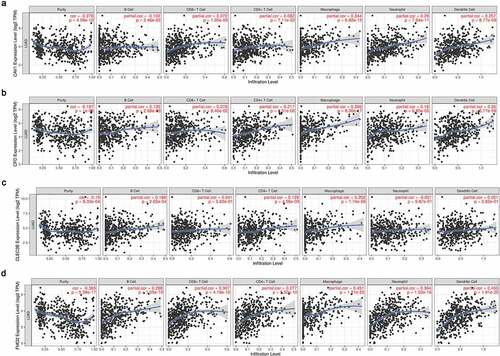
Figure 7. Correlations between biomarker expression and tumor infiltration with different calculation methods