
Figures & data
Table 1. The clinical characteristics of the patients
Figure 1. Prognostic differentially expressed CSRs. a. Heatmap of differentially expressed CSRs. b. Volcano plots of differentially expressed CSRs. c. UCR analysis for the CSRs identification in the TCGA patient cohort
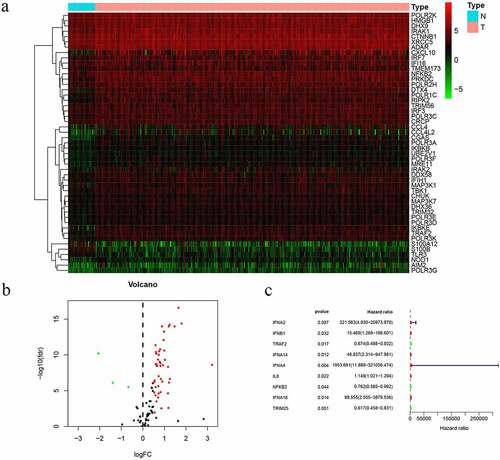
Figure 2. Biological function analysis of differentially expressed CSRs: GO analysis (a) and KEGG pathways analysis (b)
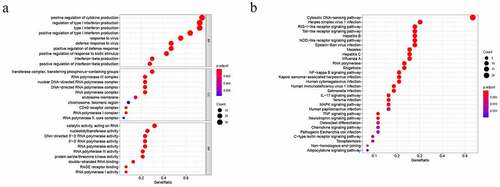
Table 2. The coefficients of each gene
Figure 3. Risk score, reflecting overall survival, based on the CSRs signature comprising five genes, in the training and validation cohorts. (a–b) Kaplan-Meier curve for OS of patients with high- and low risk scores in the training and validation cohorts. (c–d) Risk-score distribution in the training and validation cohorts. (e–f) The survival status plot associated with risk score in the training and validation cohorts. (g–h) Heatmap of the expression of the five CSRs in the high- and low-risk groups and the training and validation cohorts
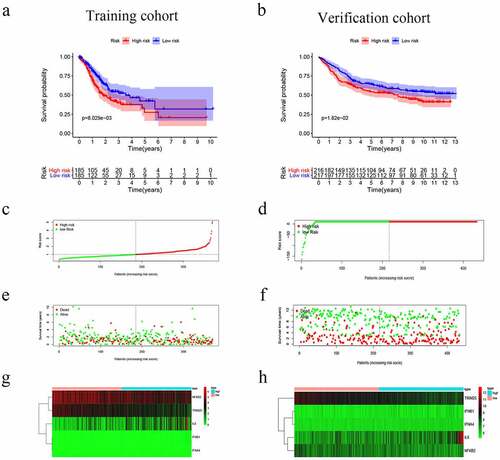
Figure 4. The model was combined with a regression analysis of clinical indicators. (a-b) Assessment of the contribution of each factor to GC survival by UCR and MCR analysis in training cohort. (c, d) Assessment of the contribution of each factor to GC survival by UCR and MCR analysis in verification cohort
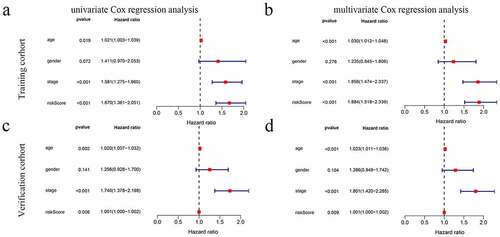
Figure 5. The ROC curves and nomograms for predicting survival rate of GC. (a, c) ROC curves (receiver operating characteristics). (b, d) Nomogram
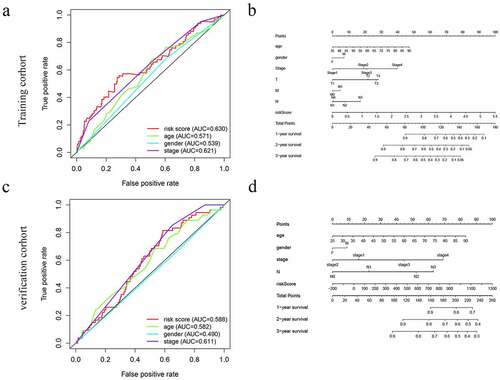
Table 3. cGAS-STING pathway related gene sets that associated with high-risk group
Figure 6. The GSEA of possible pathways of high-risk groups in GC
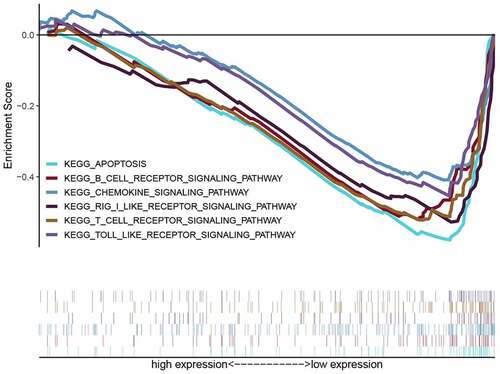
Figure 7. Correlation analysis of the risk score model and immune cell infiltration. (a) B cells, (b) DCs, (c) CD4 + T cells, (d) macrophages, (e) CD8 + T cells, (f) Neutrophils
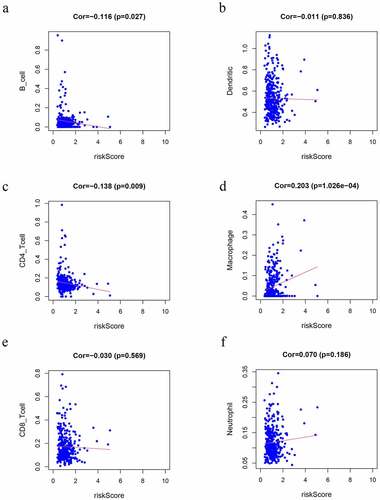
Figure 8. Immune landscape of patients from High- and Low-Riskgroups. Differences of 22 subtypes of immune cells between two groups of TCGA dataset(a), and GEO database (b)
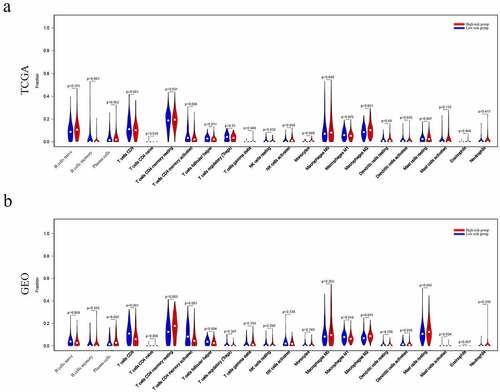
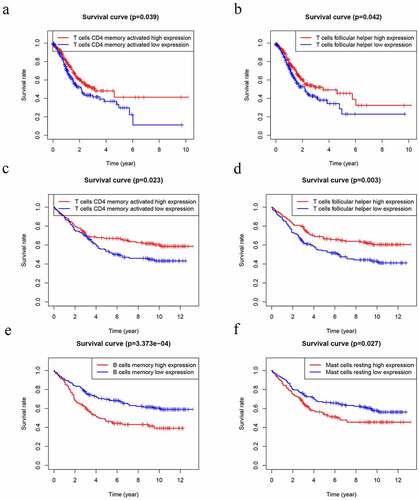
Figure 9. Kaplan–Meier analysis of 22 kinds of immune cells. (a-b) The levels of T cells CD4 memory activated (a) and T cells follicular helper (b) were significantly associated with OS in patients with GC in TCGA database. (d-f) The levels of T cells CD4 memory activated (c), T cells follicular helper (d), B cells memory (e) and Mast cells resting (f) were significantly associated with OS in patients with GC in GEO database
Supplemental Material
Download ()
Availability of data and materials
The datasets analyzed was acquired from The Cancer Genome Atlas (TCGA) database (https://portal.gdc.cancer.gov/) and GEO database (https://www.ncbi.nlm.nih.gov/geo/).