
Figures & data
Figure 1. Expression of NPTX2 in gastric cancer cells. (a) The mRNA expression of NPTX2 was determined by qRT-PCR in gastric cancer cell lines (NCI-N87, HGC-27, AGS and SNU-1) and normal human gastric mucosal cells (GES-1). (b) The protein expression of NPTX2 was measured by western blot. **p < 0.01 versus GES-1 cells
Figure 2. Methylation analysis of NPTX2 in gastric cancer cells. (a) The methylation of NPTX2 promoter in human gastric mucosal cells (GES-1) and gastric cancer cells (NCI-N87, HGC-27, AGS and SNU-1) was assessed by MS-PCR. (b) After GES-1 and gastric cancer cells were treated with 5Aza-Dc and TSA, either alone or in combination, the mRNA expression of NPTX2 was detected by qRT-PCR.(c)NPTX2 methylation was negatively correlated with NPTX2 expression *p < 0.05, **p < 0.01 versus control or 5Aza-Dc
Figure 3. Effect of NPTX2 on the proliferation of gastric cancer cells. (a) After human gastric mucosal cells (GES-1) and gastric cancer cells (NCI-N87 and HGC-27) were, respectively, transfected with NPTX2 plasmid (NPTX2), control plasmid (control), shRNA NPTX2 (shNPTX2) and control shRNA (shNC), the protein expression of NPTX2 was examined by western blot. (b) The cell viability of the transfected cells was determined by CCK-8 assay. (c) The proliferation of the transfected cells was measured by colony formation assay. *p < 0.05, **p < 0.01 versus control or shNC
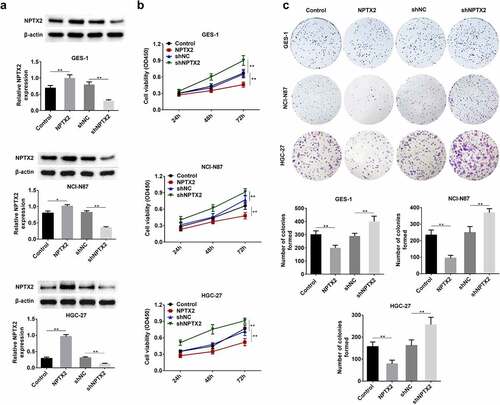
Figure 4. Effect of NPTX2 on gastric cancer cell apoptosis. After gastric cancer cells (NCI-N87 and HGC-27) were, respectively, transfected with NPTX2 plasmid (NPTX2), control plasmid (control), shRNA NPTX2 (shNPTX2) and control shRNA (shNC), the apoptosis of gastric cancer cells was determined by flow cytometry using Annexin V-FITC/PI staining. **p < 0.01 versus control or shNC
Figure 5. Effect of NPTX2 on cell cycle in gastric cancer cells. After gastric cancer cells (NCI-N87 and HGC-27) were, respectively, transfected with NPTX2 plasmid (NPTX2), control plasmid (control), shRNA NPTX2 (shNPTX2) and control shRNA (shNC), the gastric cancer cell cycle was detected by flow cytometry. *p < 0.05, **p < 0.01 versus control or shNC
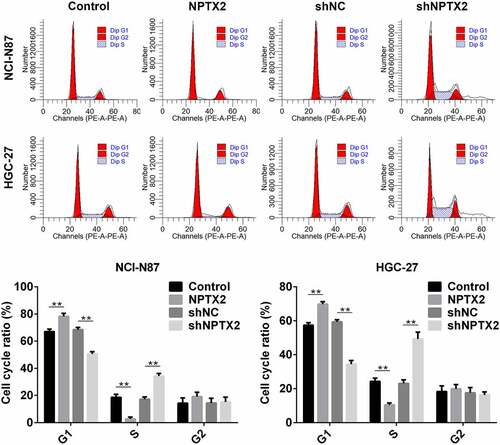
Figure 6. Effect of NPTX2 on the p53 signaling pathway in gastric cancer cells. After gastric cancer cells (NCI-N87 and HGC-27) were, respectively, transfected with NPTX2 plasmid (NPTX2), control plasmid (control), shRNA NPTX2 (shNPTX2) and control shRNA (shNC), the expression of key proteins (PTEN, p53 and p21) in the p53 signaling pathway was measured by western blot. **p < 0.01 versus control or shNC
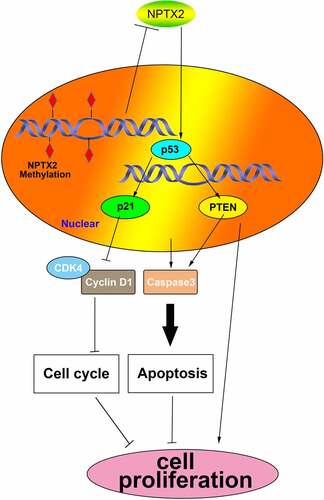
Figure 7. The mechanism diagram of NPTX2 acting on the p53 signaling pathway in gastric cancer cells
Availability of data and materials
All data generated or analyzed during this study are included in this published article.