Figures & data
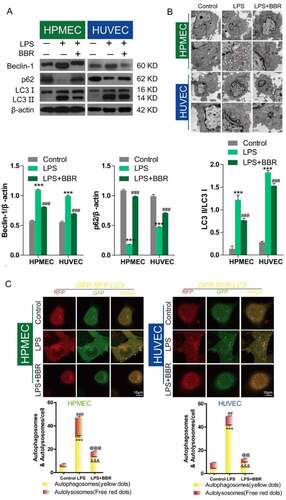
Figure 1. Effect of BBR on the viability and proliferation of LPS-treated HUVECs and HPMECs. A & B. Cell Counting Kit-8 (CCK-8) was used to analyze the effect of LPS on the cell viability of HUVECs and HPMECs, and the protective effect of BBR. ***P < 0.001 vs. control; #P < 0.05, ###P < 0.001 vs. LPS. C & D. EdU analysis of cell proliferation following LPS only, BBR only, and BBR+LPS treatment. All scale bars indicate 50 μm. **P < 0.01, ***P < 0.001 vs. the control; #P < 0.05, ##P < 0.01 vs. LPS. E. Apoptosis detection by flow cytometry analysis after treatment with LPS only, BBR only, and BBR+LPS. ***P < 0.001 vs. the control; ###P < 0.001 vs. LPS
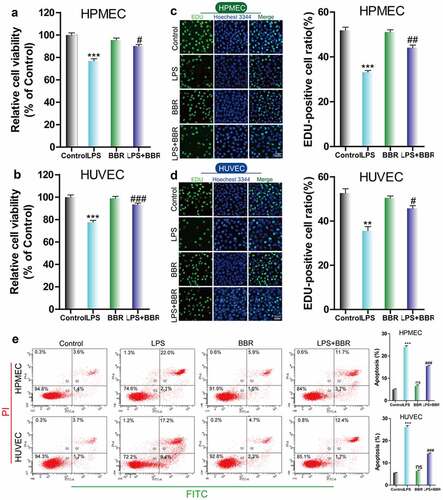
Figure 2. Antagonistic effect of BBR on LPS-induced autophagy in HUVECs and HPMECs. A. Beclin-1 and p62 expression and LC3-II accumulation after treatment with LPS alone, BBR alone, or BBR combined with LPS was determined by western blot analysis. B. Autophagic vacuoles were examined by transmission electron microscopy. C. LC3 double-fluorescence was determined by confocal microscopy analysis. Autophagosomes (yellow dots): ***P < 0.001 vs. the control; &&&P < 0.001 vs. LPS; Autolysosomes (free red dots): ##P < 0.01, ###P < 0.001 vs. the control; @@P < 0.01, @@@P < 0.001 vs. LPS
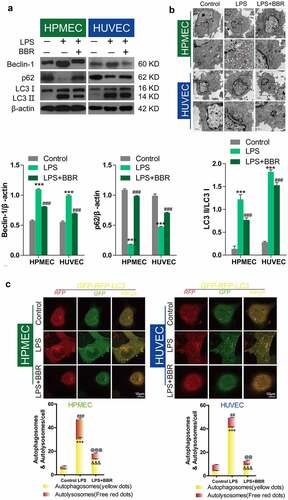
Figure 3. Effect of RAPA and 3-MA on LPS-induced cell damage in HUVECs and HPMECs. A & B. CCK-8 analysis of cell viability with or without RAPA or 3-MA treatment after LPS induction. ***P < 0.001 vs. the control; #P < 0.05, ##P < 0.01, ###P < 0.001 vs. LPS. C & D. Cell proliferation analysis with EdU with or without RAPA or 3-MA following LPS treatment
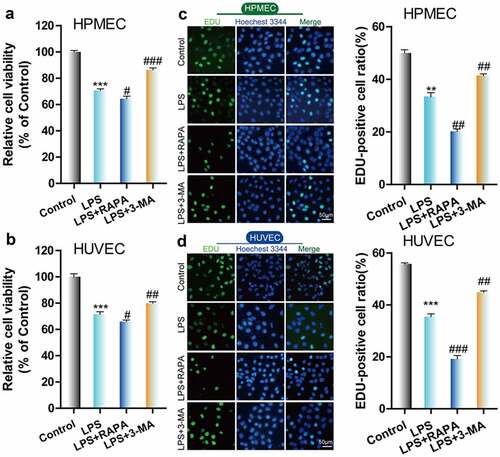
Figure 4. Effect of RAPA and 3-MA on LPS-induced cell autophagy in HUVECs and HPMECs A. Expression of autophagy markers (Beclin-1 and p62 expression and the LC3II/LC3I ratio) in different groups was determined by western blot analysis. B. Transmission electron microscopy analysis of the characteristic autophagic ultrastructures after different treatments. The arrows in the figures indicate autolysosomes. C. Confocal microscopy analysis of LC3 double fluorescence
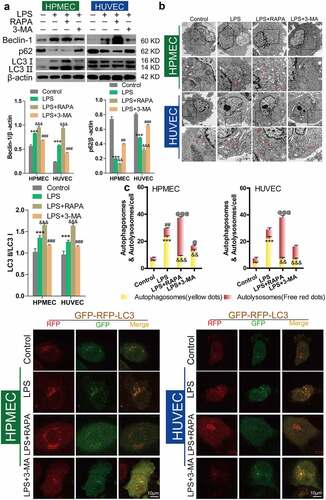
Figure 5. Role of autophagy in BBR-mediated protection from LPS-induced cell injury in HUVECs and HPMECs. A & B. CCK-8 verified the cell viability in the different treatment groups, such as BBR alone, BBR with RAPA, and BBR with 3-MA after LPS induction. ***P < 0.001 vs. the control; &&&P < 0.001 vs. LPS; #P < 0.05, ###P < 0.001 vs. LPS+BBR. C & D. EdU analysis of cell proliferation in HUVECs and HPMECs by BBR, BBR with RAPA, and BBR with 3-MA treatment after LPS induction
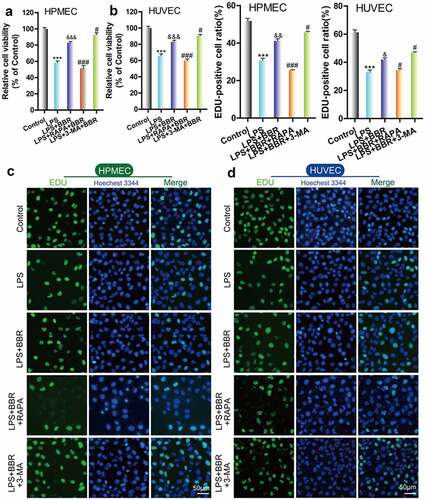
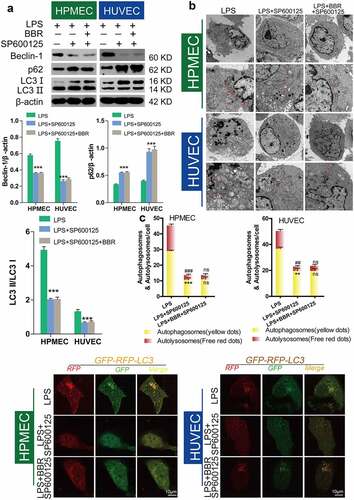
Figure 6. Inhibition of LPS-induced autophagy in HUVECs and HPMECs treated with SP600125. A. Changes in the expression of the autophagy indicators beclin-1, p62, and LC3 were examined by western blot analysis. B. In the transmission electron microscopy images, the ultrastructures observed are characteristic of autophagic cells and the arrows indicate autolysosomes. C. Confocal microscopy analysis of LC3 double fluorescence. Autophagosomes (yellow dot): *P < 0.05, **P < 0.01 vs. the control; autolysosomes (free red dots): ###P < 0.001 vs. the control; @@@P < 0.001 vs. LPS
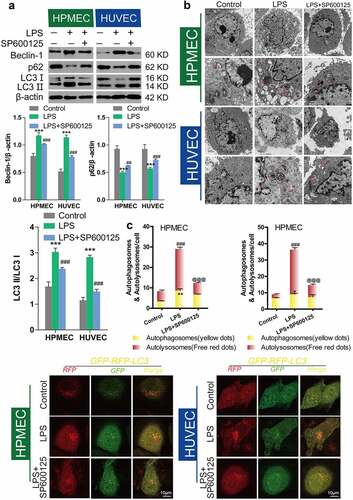
Figure 7. Inhibition of autophagy in HUVECs and HPMECs by BBR via blocking of the JNK pathway A. Changes in the expression of the autophagy indicators beclin-1, p62, and LC3 were determined by western blot analysis. B. Transmission electron microscopy images depict the ultrastructures of characteristic autophagic cells, and the arrows indicate autolysosomes. C. Confocal microscopy analysis of LC3 double fluorescence. Autophagosomes (yellow dots): **P < 0.01, ***P < 0.001 vs. LPS; autolysosomes (free red dots): ##P < 0.01, ###P < 0.001 vs. LPS