Figures & data
Graphi Cal Abstract
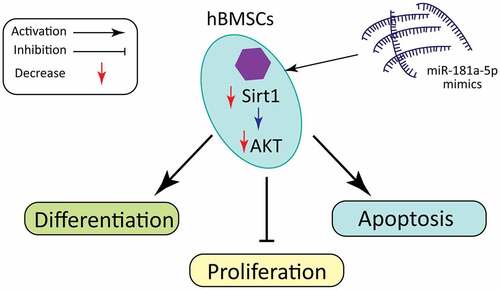
Table 1. The reverse transcription (RT) primer, forward and reverse primers
Figure 1. Effect of miR-181a-5p on the hBMSCs viability.A. Expression of miR-181a-5p on OP specimens. B. Expression of miR-181a-5p in β-glycerophosphate induced hBMSCs cell at different time intervals. C. The expression of miR-181a-5p in hBMSCs of different treatment groups was determined by RT-qPCR. D. The effect of overexpression or inhibition of miR-181a-5p on the hBMSCs viability was detected by CCK-8 experiment. n = 3, *p < 0.05 and **p < 0.01
Figure 2. Effect of miR-181a-5p on the hBMSCs apoptosis. A. B. Apoptosis of hBMSCs in different treatment groups was detected by flow cytometry. C. D. Expression of apoptosis marker proteins (Cleaved caspase3, Bcl2, and Bax) in different treatment groups. n = 3, *p < 0.05 and **p < 0.01
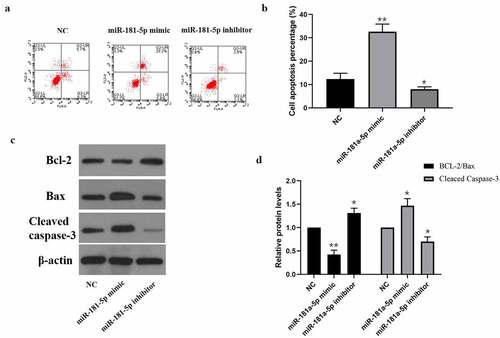
Figure 3. Effect of miR-181a-5p on the hBMSCs differentiation. A. ALP activity was detected by the ALP activity kit. B. ALP staining. C. Alizarin red staining. D. The expressions of OPN, OCN and Runx2 mRNA were detected by qRT-PCR. E. F. The expressions of OPN, OCN and Runx2 protein were detected by western blot. n = 3, *p < 0.05 and **p < 0.01
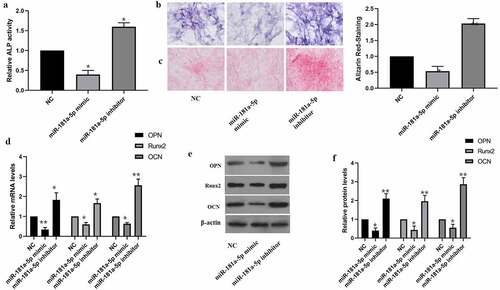
Figure 4. MiR-181a-5p targeting Sirt1. A. Dual Luciferase Reporter assay showed miR-181a-5p targeting Sirt1. B. C. Protein expression level of Sirt1 after overexpression or silencing of miR-181a-5p. D. Protein expression of transdifferentiation genes after sirt1 silencing. E. Protein expression of transdifferentiation genes after sirt1 overexpression. n = 3, *p < 0.05 and **p < 0.01
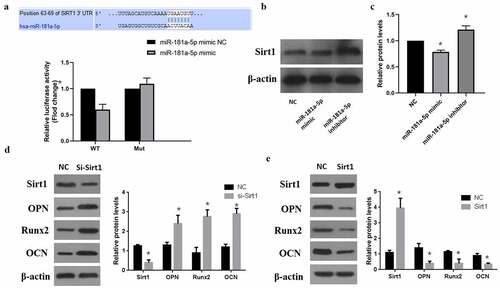
Figure 5. MiR-181a-5p regulate the differentiation and apoptosis of hBMSCs through Sirt1. A. B. After overexpression and silence of miR-181a-5p or overexpression and silence or over expression of Sirt1, the apoptosis of hBMSCs was detected by flow cytometry (a), and hBMSCs were stained with Alizarin Red and ALP activity (b). C. Protein expression of transdifferentiation genes after overexpression and silence of miR-181a-5p or overexpression and silence or over expression of Sirt1. n = 3, *p < 0.05 and **p < 0.01
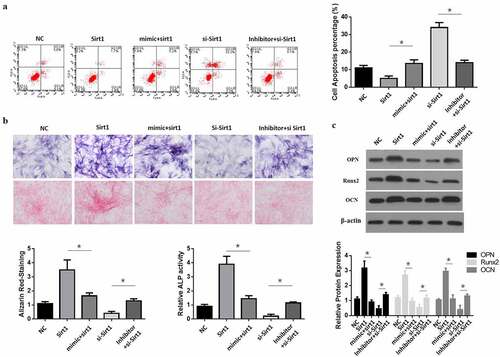
Figure 6. MiR-181a-5p regulated the PI3K/AKT pathway via Sirt1 in hBMSCs. A. B. After overexpression and silence of miR-181a-5p or overexpression and silence of Sirt1, the PI3K/AKT of hBMSCs was detected by western blot. n = 3, *p < 0.05 and **p < 0.01