
Figures & data
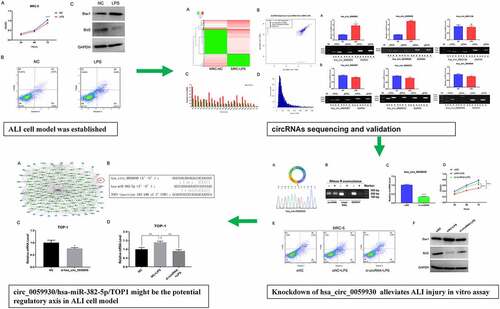
Table 1. Primers used for qRT-PCR and RT-PCR methods
Figure 1. LPS markedly suppressed proliferation and accelerate apoptosis in MRC-5 cells. (a) Proliferation reduction was confirmed by CCK-8 assay in MRC-5 cells when handled with 100 ng/mL LPS for 24 h, ****P < 0.0001. (b) After processing with LPS, the apoptosis of MRC-5 cells was identified through the application of flow cytometer. (c) Western blot analysis revealed the expressions of Bax1 and Bcl2 in LPS-induced MRC-5 cells
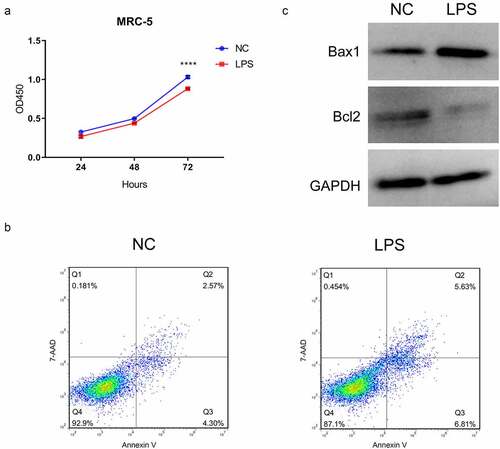
Figure 2. Differential expression profile of circRNAs in LPS-induced and non-induced MRC-5 cells. (a) The expressions of circRNAs in LPS-induced and non-induced MRC-5 cells were presented using the hierarchical clustering analysis in red (high expression) and green (low expression). (b) Volcano plot of differential circRNAs in LPS-induced and non-induced MRC-5 cells. (c) Histogram exhibited the number of differential circRNAs on each chromosome. (d) The length distribution of differential circRNAs in LPS-induced and non-induced MRC-5 cells
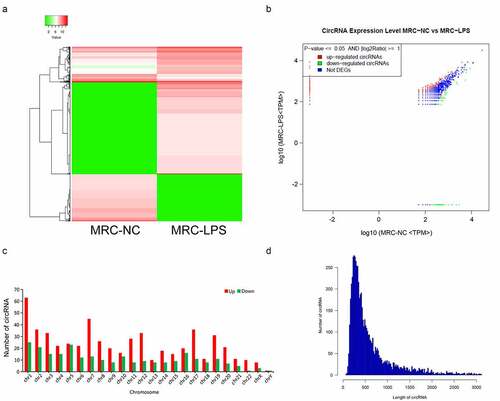
Figure 3. Identification of six circRNAs with the greatest expression difference in LPS-induced MRC-5 cells. (a) qRT-PCR and RT-PCR assays verified the existences and expressions of the three upregulated circRNAs (hsa_circ_0000002, hsa_circ_0059930, and hsa_circ_0001136) in LPS-induced MRC-5 cells. (b) The three downregulated circRNAs (hsa_circ_0004087, hsa_circ_0000523, and hsa_circ_0000944) were also tested by qRT-PCR and RT-PCR assays in LPS-induced MRC-5 cells. *P < 0.05, **P < 0.01, ****P < 0.0001, ns: no significant
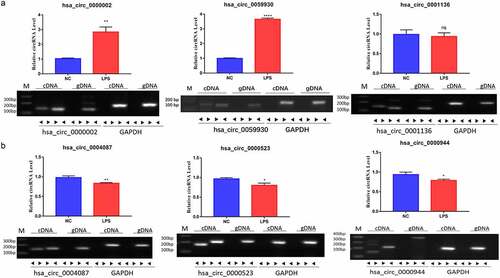
Figure 4. Knockdown of hsa_circ_0059930 observably enhanced proliferation and inhibited apoptosis in LPS-induced MRC-5 cells. (a) According to the formation of hsa_circ_0059930, the back splice structure of hsa_circ_0059930 was confirmed via Sanger sequencing. (b) Stability of hsa_circ_0059930 was confirmed via RNase R treatment assay. (c) After hsa_circ_0059930 interference, the interference effect of hsa_circ_0059930 was determined by qRT-PCR analysis in MRC-5 cells, ****P < 0.0001. (d) CCK-8 assay was applied to confirm the impact of hsa_circ_0059930 silencing on the proliferation of LPS-induced MRC-5 cells, ****P < 0.0001. (e) After hsa_circ_0059930 knockdown, cell apoptosis was determined by applying flow cytometer in LPS-induced MRC-5 cells. (f) The expression changes of Bax1 and Bcl2 were monitored by western blot assay. ****P < 0.0001
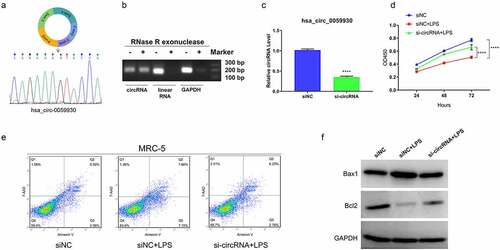
Figure 5. The expression profile and function annotation of distinct mRNAs in LPS-induced and non-induced MRC-5 cells. (a) Based on sequencing results, hierarchical clustering analysis showed the differential mRNAs between MRC-5-NC and MRC-5-LPS groups. (b) Scatterplots of the differential mRNAs in LPS-induced and non-induced MRC-5 cells. Red, green, and blue dots indicate the upregulated, downregulated, and unchanged mRNA, respectively. (c) The GO analysis of the differential mRNAs. (d) Top 20 KEGG pathways were enriched by the differential mRNAs
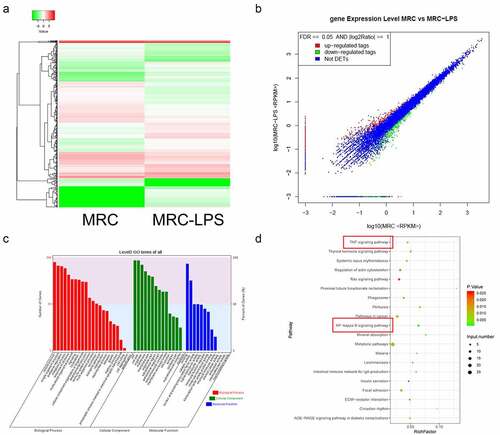
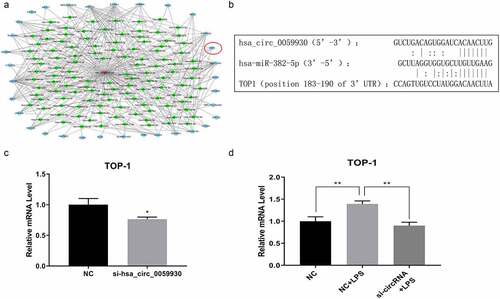
Figure 6. hsa_circ_0059930/hsa-miR-382-5p/TOP1 might be the potential regulatory axis in LPS-induced ALI. (a) Based on the circRNA and mRNA sequencing results, the related network of hsa_circ_0059930 was analyzed. (b) Through bioinformatics analysis, we predicted and displayed the potential binding sites between hsa-miR-382-5p and hsa_circ_0059930 or between hsa-miR-382-5p and TOP1. (c) qRT-PCR assay was employed for the silence identification of hsa_circ_0059930 in MRC-5 cells, *P < 0.05. (d) qRT-PCR analysis was also applied to assess the influence of hsa_circ_0059930 interference on the TOP1 expression in LPS-induced MRC-5 cells, **P < 0.01
Supplemental Material
Download ()Data availability statement
The data sets generated during and/or analyzed during the current study are available from the corresponding author on reasonable request. And the circRNAs and mRNAs profile data were deposited at NCBI under BioProject number PRJNA726358.