Figures & data
Figure 1. Concentration of AGEs (CML and imidazolone) in M-HSA (ELISA)
Figure 2. A HUVEC viability in the blank group, HSA, M-HSA and M-HSA+FPS-ZM1 (CCK-8) **P < 0.01; B-C HUVEC viability in the blank group, HSA, M-HSA and M-HSA+FPS-ZM1 (flow cytometry) ##P < 0.01, ***P < 0.001
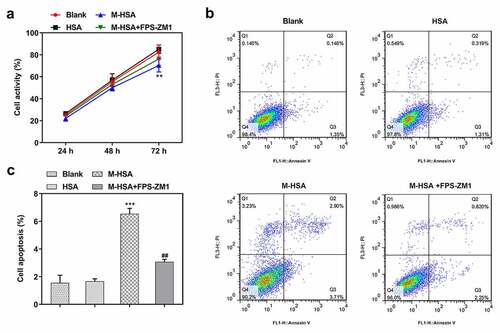
Figure 3. A-C relative expressions of pro-inflammatory cytokines in the blank group, HSA, M-HSA and M-HSA+FPS-ZM1 (ELISA) ***P < 0.001, ###P < 0.001; D-E relative expressions of ROS, MDA and SOD in the blank group, HSA, M-HSA or M-HSA+FPS-ZM1 (commercial kits) ##P < 0.01 ***P < 0.001, ###P < 0.001
Figure 4. A relative expression of NO in the blank group, HSA, M-HSA or M-HSA+FPS-ZM1 (commercial kit) ***P < 0.001, ###P < 0.001; B-C Images of CE-1 and eNOS expressions in the blank group, HSA, M-HSA and M-HSA+FPS-ZM1 (commercial kit)
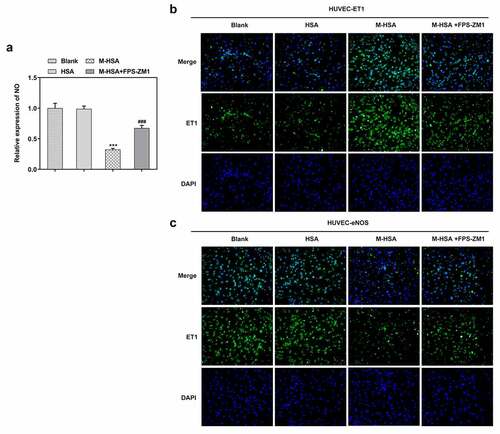
Figure 5. A relative expressions of Bax, Bcl-2 and C-Caspase3 in the blank group, HSA, M-HSA and M-HSA+FPS-ZM1 (WB) ***P < 0.001, ##P < 0.01, ###P < 0.001; B relative expressions of RAGE and p-p65 in the blank group, HSA, M-HSA and M-HSA+FPS-ZM1 (WB) ***P < 0.001, ##P < 0.01, ###P < 0.001; C relative expressions of ET-1, eNOS and iNOS in the blank group, HSA, M-HSA or M-HSA+FPS-ZM1 (WB) ***P < 0.001, ##P < 0.01, ###P < 0.001