Figures & data
Table 1. Top ranking list of up-related and down-related genes sepsis-induced ARDS
Figure 1. Differential gene expression analysis of sepsis-induced ARDS and control samples. (a) Bidirectional hierarchical clustering of sepsis-induced ARDS and control samples. Each row represented a gene, each column represented a sample. Sepsis-induced ARDS samples are labeled as red and the control samples are labeled as blue. The heatmap shows the Z-score of relative gene expression of each samples; (b) Volcano plot for DEGs between sepsis-induced ARDS and control samples. X-axes indicates -log (FDR) and y-axes showes the log2 fold change. Red dots represent significantly up-regulated genes and green ones represents the down-regulated genes
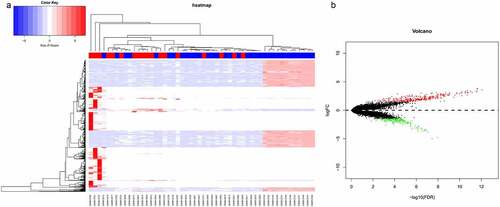
Figure 2. Functional enrichment analysis of the DEGs between sepsis-induced ARDS and control samples. DAVID bioinformatic tools were used for functional enrichment analysis of the DEGs between sepsis-induced ARDS and control samples. Gene number, enrichment score (rich factor) and the enrichment p value of each biological process were displayed in the bubble plot
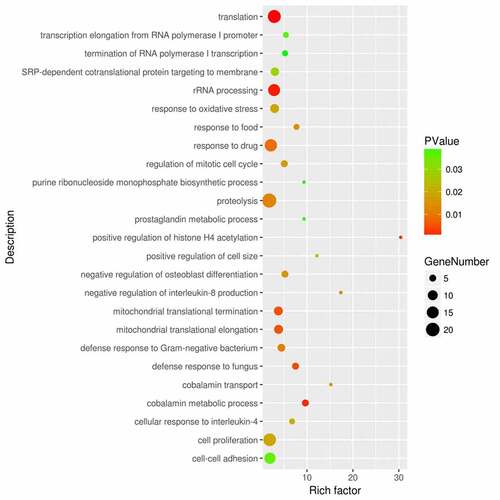
Figure 3. GSEA analysis shows significant up-regulation of genes in anti-bacterial and anti-fungus defense response in sepsis-induced ARDS samples
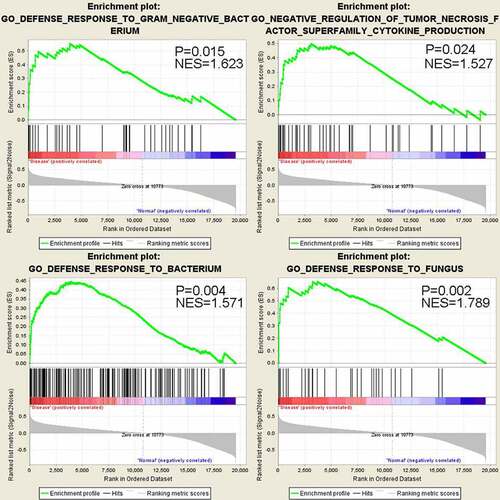
Figure 4. Protein-protein interaction (PPI) network analysis of DEGs between sepsis-induced ARDS and control samples. Each node represents a gene each edge represents an interaction pair. The size and color of each node shows the importance of the gene in the network
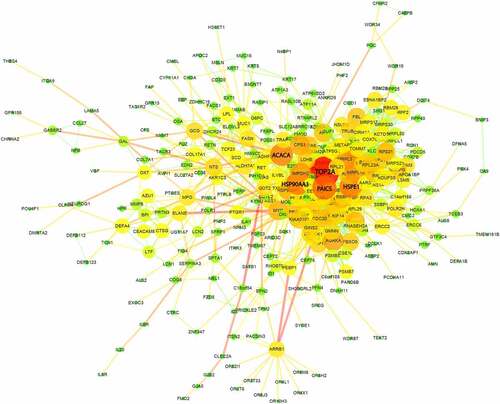
Table 2. Prediction of potential therapeutic drugs for sepsis-induced ARDS by connectivity map
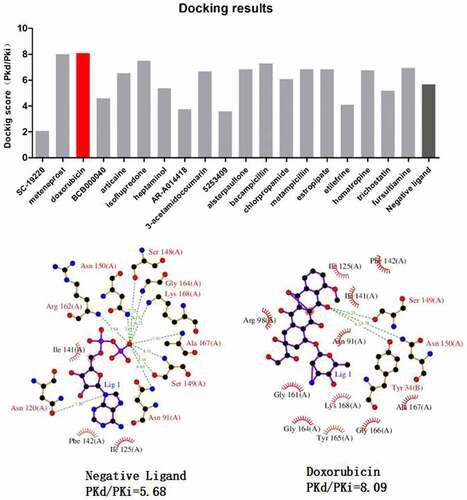
Figure 5. Molecular docking analysis of candidate drugs predicted by Cmap analysis. The lower panel shows the 2D schema chart of TOP2A endogenous ligands and Doxorubicin docking with TOP2A