Figures & data
Figure 1. Expression levels of DGKZ in cervical cancer tissues and paired adjacent normal cervical tissues. (a) Immunohistochemical staining and Tissue Microarray Assay (TMA) of DGKZ protein in 31 tumor tissues and 31 adjacent non-tumor tissues from CC patients. (b) Relative expression of DGKZ in CC and normal group quantified by box-and-whisker plot. (***p < 0.001)
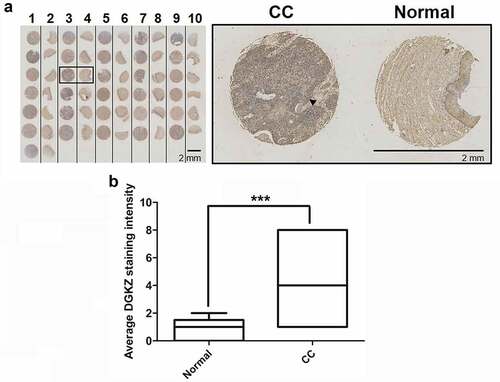
Figure 2. SiHa and HeLa cells were transfected with lentivirus plasmids (sh-NC or sh-DGKZ) to regulate DGKZ expression. (a, b) The efficient silencing of DGKZ expression in SiHa cells and HeLa cells was verified using Immunofluorescence assay. (c)The efficient silencing of DGKZ expression in SiHa and HeLa cells was verified by RT-qPCR. (d) The efficient silencing of DGKZ expression in SiHa and HeLa cells was verified by western blot analysis. (**p < 0.01)
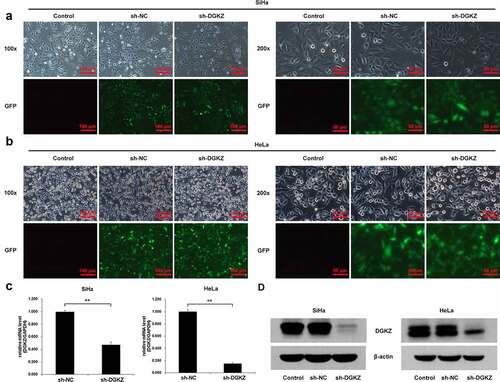
Figure 3. Downregulation of DGKZ repressed proliferation of SiHa and HeLa cells. (a) Proliferation of SiHa and HeLa cells transfected with sh-NC or sh-DGKZ during 5 d was detected by CCK-8 assay. (b, c) Cell cycle distribution of SiHa or HeLa cells transfected with sh-NC or sh-DGKZ was determined by flow cytometry via PI staining. (**p < 0.01)
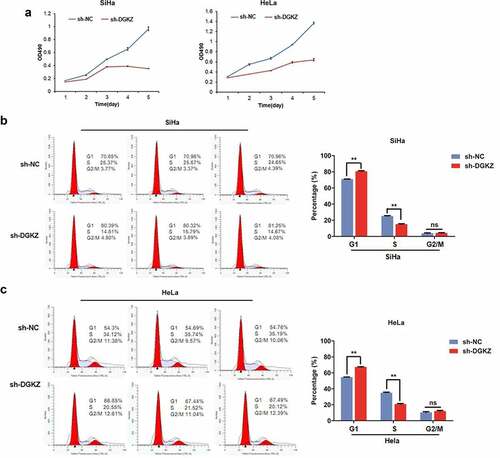
Figure 4. Silence of DGKZ facilitated apoptosis of SiHa and HeLa cells . (a, b) Apoptosis of SiHa or HeLa cells transfected with sh-NC or sh-DGKZ was assessed by flow cytometry via Annexin V-APC staining (**p < 0.01). (c) cCaspase3/7 activity in SiHa or HeLa cells transfected with sh-NC or sh-DGKZ was examined using Caspase-Glo 3/7 assay. (**p < 0.01)
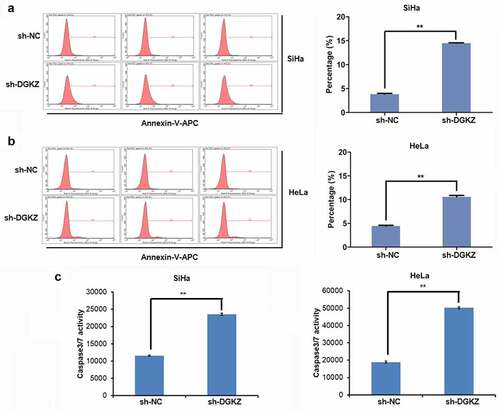
Figure 5. Suppression of DGKZ slowed progression of cervical cancer in vivo. (a) Photographs of xenografts of BALB/c nude mice for 31d post-injection. (b) Tumor volume (mm3) of BALB/c mice injected subcutaneously with Lentivirus-sh-DGKZ-SiHa cells or Lentivirus-sh-NC-SiHa cells. (c) Tumor weight (g) of BALB/c mice injected subcutaneously with Lentivirus-sh-DGKZ-SiHa cells or Lentivirus-sh-NC-SiHa cells. (d–e) Representative images of fluorescence imaging and analysis. (**p < 0.01)
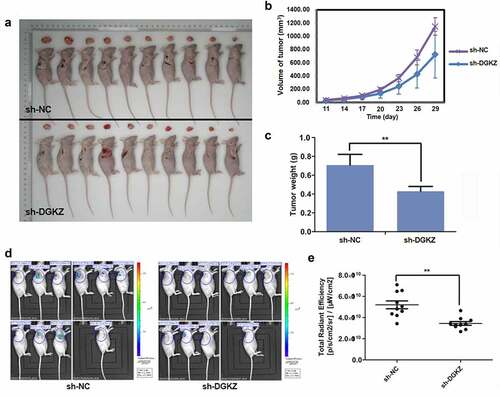
Figure 6. Expression profiles in sh-DGKZ-SiHa cells or sh-NC-SiHa cells. In the volcano plots, the red points represent the differentially upregulated proteins and the blue points represent the differentially downregulated proteins
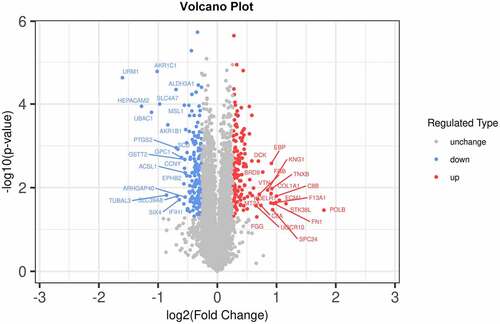
Figure 7. Biological processes and pathways associated with DGKZ in CC. (a) GO enrichment analysis on the different genes in cervical cancer profiles. The ordinate represents the GO items and the abscissa represents the number of different genes. (b) KEGG functional enrichment analysis of DEPs in cervical cancer expression profile. The ordinate represents the KEGG items and the abscissa represents the number of different genes
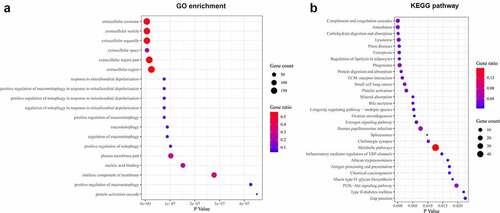
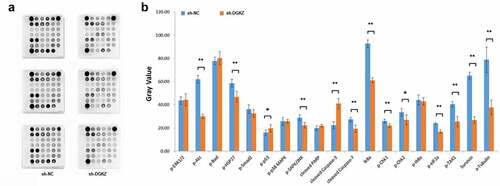
Figure 8. Identification of DGKZ knockdown-related gene expression. (a)The PathScan Stress and Apoptosis Signaling Antibody Array Kit was performed to assess the signaling molecules that were associated with downregulation of DGKZ in SiHa cells. (b) Quantitative array data by array analysis software. (*p < 0.05, **p < 0.01)