Figures & data
Figure 1. Hsa_circ_0000117 levels in GC. (a) Hsa_circ_0000117 schematic. (b) Hsa_circ_0000117 levels in GC tissue. (c) Hsa_circ_0000117 levels in GC cells. (d) Hsa_circ_0000117 expression is linked to TNM stage in GC patients. (e) Hsa_circ_0000117 expression is linked to lymphatic metastasis in GC patients. *P < 0.05
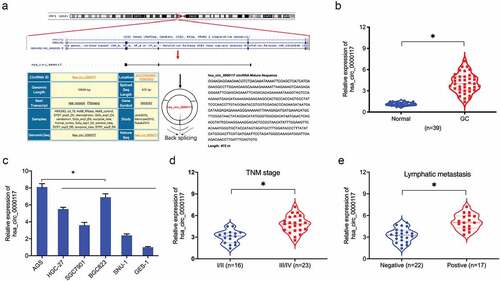
Figure 2. Hsa_circ_0000117 silencing suppresses GC cell proliferation and invasion. (a) Quantitative RT-PCR verified the interference efficiency of si-hsa_circ_0000117 in GC cells. (b–d) Phenotypic growth assays assessing the silencing effects of hsa_circ_0000117 on AGS and BGC823 proliferation. (e) Transwell assays assessed the effects of si-circ_0000117 on AGS and BGC823 invasion. *P < 0.05
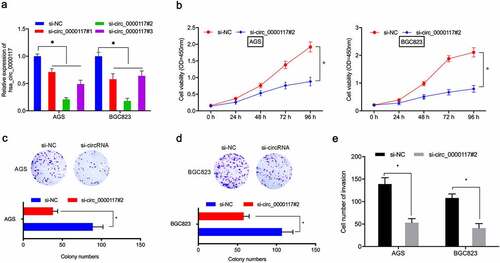
Figure 3. Hsa_circ_0000117 is a miR-337-3p sponge. (a) Hsa_circ_0000117 distribution in GC cells. (b) Target miRNAs of hsa_circ_0000117 were predicted using circInteractome and circBank databases. (c) MiR-337-3p and miR-502-5p binding to hsa_circ_0000117 in GC cells by pull-down assay. (d, e) The miR-337-3p/hsa_circ_0000117 relationship was characterized using a dual-luciferase reporter system. (f, g) MiR-337-3p levels in GC tissue. (h) Hsa_circ_0000117 silencing elevated miR-337-3p expression in GC cells. *P < 0.05
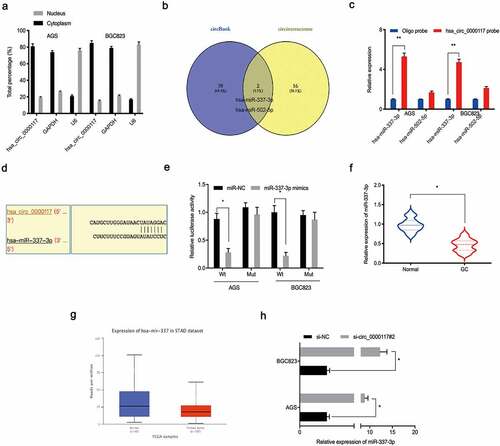
Figure 4. STAT3 is a target of miR-337-3p in GC cells. (a) Target genes for miR-337-3p were investigated using mirTarBase and MicroT-CDS databases. (b, c) Target gene expression using the TCGA database. (d) Immunohistochemistry showing STAT3 expression in GC tissues. (e, f) Kaplan-Meier analysis showing elevated STAT3 expression was associated with poor overall survival in GC patients. (g, h) STAT3 inhibition decreased AGS colony formation and invasion. *P < 0.05
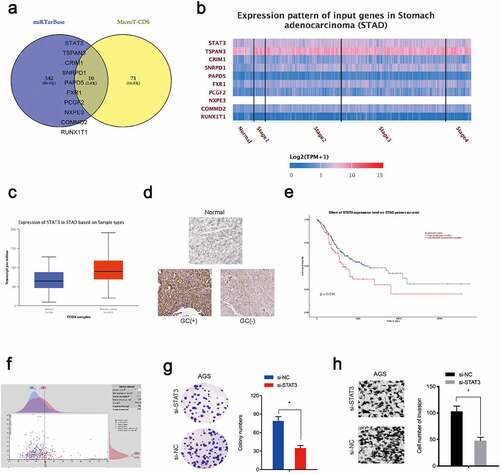
Figure 5. MiR-337-3p targets STAT3 in GC. (a) STAT3 binding sites for miR-337-3p were predicted using online software. (b) MiR-337-3p secondary structure. (c) Targeting interactions between STAT3 and miR-337-3p were analyzed using the dual-luciferase reporter assay. (d, e) MiR-337-3p mimics reduced STAT3 levels in AGS and BGC823 cells. (f) The association between miR-337-3p and STAT3 in GC tissue. *P < 0.05
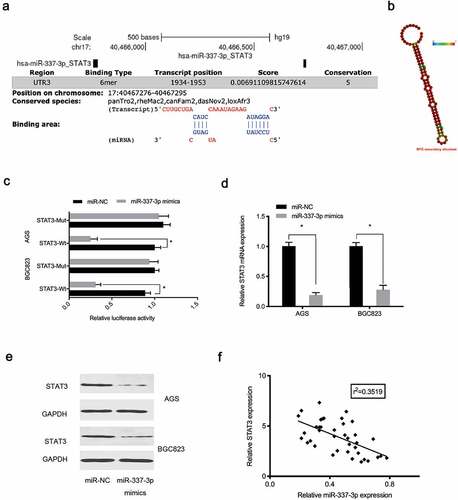
Figure 6. The hsa_circ_0000117/miR-337-3p/STAT3 axis promotes GC progression. (a) STAT3 mRNA expression in GC cells treated with si-circ_0000117 or si-circ_0000117 + anti-miR-337-3p. (b–e) STAT3 overexpression (or anti-miR-337-3p) abolished proliferation repression, and AGS cell invasion induced by hsa_circ_0000117 suppression. (f) The association between hsa_circ_0000117 and STAT3 in GC tissue. (g) The association between hsa_circ_0000117 and miR-337-3p in GC tissue. *P < 0.05
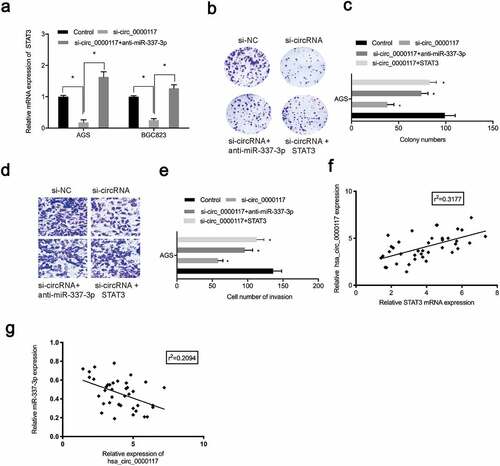
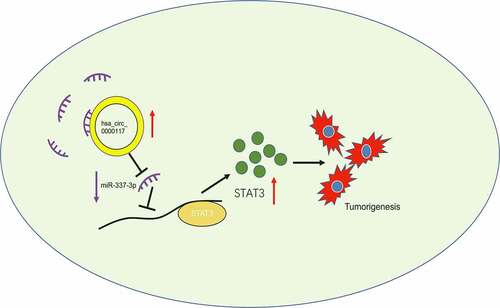
Figure 7. The hsa_circ_0000117/miR-337-3p/STAT3 axis in GC