
Figures & data
Figure 1. (a)the expression of RAB18 was analyzed through BioGRID4.2 database. (b–c)The protein and mRNA levels of RAB18 were detected through Western blotting and qPCR, respectively. ***p < 0.001
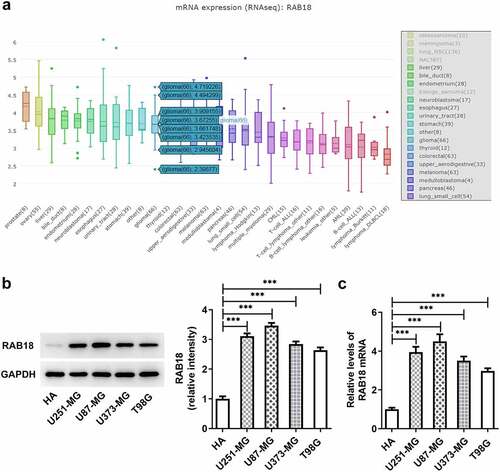
Figure 2. (a–d) siRNA induced the silencing of Rab18 analyzed by Western blot and qPCR. (e–f) U87-MG or U251-MG cells for Rab18 silencing expressed low proliferation. (g–h) siRNA targeting Rab18 induced a decrease of Ki67 and PCNA. **p < 0.01, ***p < 0.001
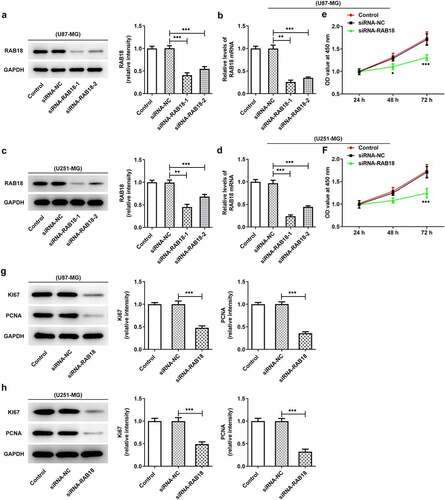
Figure 3. (a–b) Increased apoptosis levels were induced upon RAB18 silencing. (c–d) RAB18 silencing altered the expression of Bcl-2, Bax and cleaved caspase3. **p < 0.01, ***p < 0.001
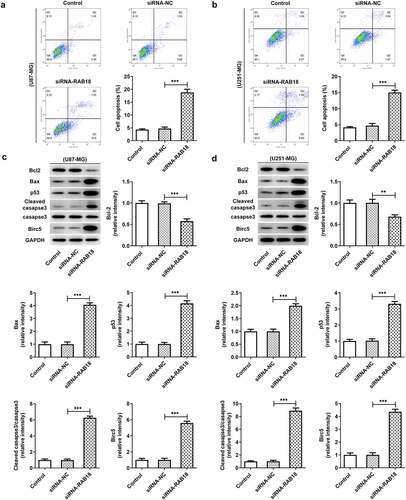
Figure 4. (a) The analysis of cell viability through CCk8 assay when U87-MG cells was subjected to the treatment of 0, 50, 100, 200 or 400 µM TMZ for 24 h. (b) U87-MG cells silenced for Rab18 were treated with TMZ for 24 h or 48 h. (c) The analysis of cell viability through CCk8 assay when U251-MG cells was subjected to the treatment of 0, 50, 100, 200 or 400 µM TMZ for 24 h. (b) U251-MG cells silenced for Rab18 were treated with TMZ for 24 h or 48 h. ***p < 0.001
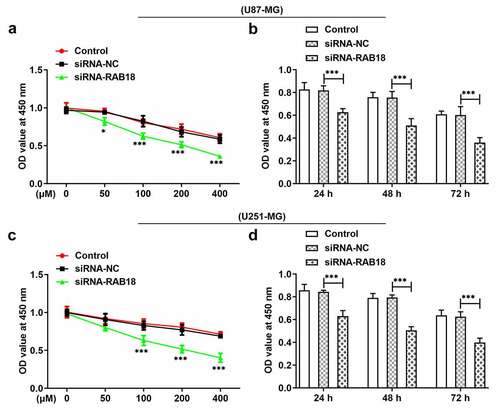
Figure 5. (a–b) The western blot analysis of VSIG4 was performed in U87-MG and U251-MG cells upon Rab18 silencing. (c–d) IP assay was performed to investigate the interaction of RAB18 and VSIG4. ***p < 0.001
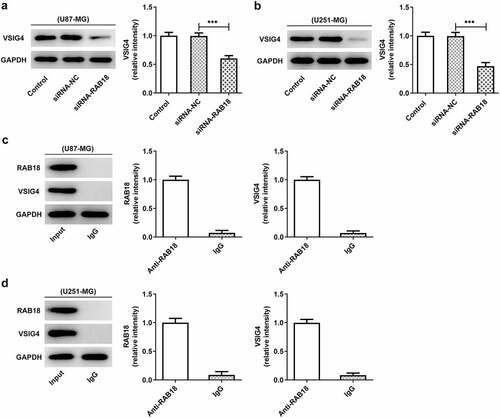
Figure 6. (a–b) The induction of VSIG4 overexpression elevated the VSIG4 mRNA levels both U87-MG and U251-MG cells. (c–f) VSIG4 overexpression rescued the inhibitory effects of Rab18 silencing on proliferation and proliferation markers. ***p < 0.001
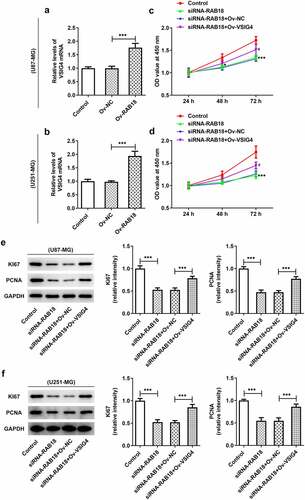
Figure 7. (a–b) VSIG4 overexpression led to a reverse in the effects of Rab18 silencing on apoptosis. (c–d) VSIG4 overexpression changed the expression of apoptosis-related proteins altered by Rab18 silencing. **p < 0.01, ***p < 0.001
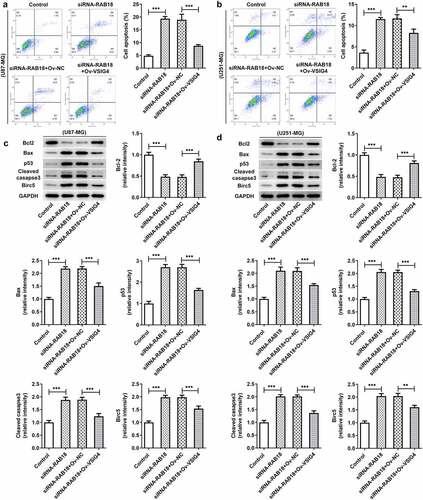
Figure 8. (a–b) The analysis of cell viability in U87-MG and U251-MG cells. **p < 0.01, ***p < 0.001
Data availability statement
The datasets used during the current study are available from the corresponding author and the first author on reasonable request.