Figures & data
Figure 1. INHBA-AS1 is highly expressed in hHSFs and miR-141-3p is directly targeted by INHBA-AS1. (a) INHBA-AS1 expression in hHSFs and CCC-ESF-1 was examined using RT-qPCR. **P < 0.01 vs. CCC-ESF-1. (b) Binding region between INHBA-AS1 and miR-141-3p. (c) miR-141-3p level in hHSFs and CCC-ESF-1 was detected using RT-qPCR. **P < 0.01 vs. CCC-ESF-1. (d) INHBA-AS1 expression was measured using RT-qPCR after transfection with sh-INHBA-AS1-1 or sh-INHBA-AS1-2. (e) miR-141-3p level was examined using RT-qPCR when INHBA-AS1 was silenced. ***P < 0.001 vs. shRNA-NC. (f) RT-qPCR was used to evaluate miR-141-3p expression after transfection with miR-141-3p mimic. ***P < 0.001 vs. mimic-NC. (g) Relative luciferase activities were detected in hHSFs. ***P < 0.001 vs. mimic-NC+ INHBA-AS1. (h) RIP assay were conducted to measure the enrichment of INHBA-AS1 and miR-141-3p in the Ago2 immunoprecipitation and IgG-pellet. hHSFs, human hypertrophic scar fibroblasts; sh, short hairpin; NC, negative control; WT, wild-type; MUT, mutant
Figure 2. MiR-141-3p silencing markedly alleviates the inhibitory impact of INHBA-AS1-knockdown on proliferation and migration of hHSFs. (a) MiR-141-3p expression was tested using RT-qPCR after transfection with miR-141-3p inhibitor. **P < 0.01 vs. inhibitor-NC. (b) Cell viability was measured by a cell counting Kit-8 assay. (c) Western blot analysis was utilized for detecting the expression of Ki67. (d and e) Wound healing assay and (f and g) Transwell migration assay were performed to evaluate migration of hHSFs. ***P < 0.001 vs. mimic-NC. *P < 0.05, ***P < 0.001 vs. shRNA-NC; ###P < 0.001 vs. sh-INHBA-AS1-1+ inhibitor-NC. hHSFs, human hypertrophic scar fibroblasts; sh, short hairpin; NC, negative control
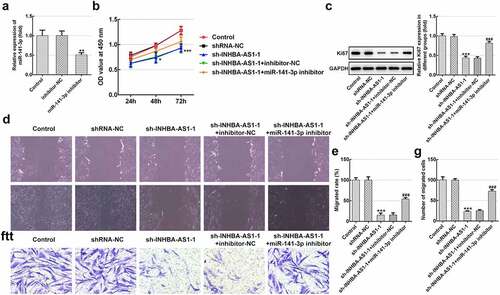
Figure 3. MiR-141-3p inhibitor restores the effects of INHBA-AS1-knockdown on the ECM deposition of hHSFs. (a) Expression of col I was measured by immunofluorescence assay. (b and c) The protein expression and (d) mRNA expression of Col III, Col IV and α-SMA were detected using western blot analysis and RT-qPCR, respectively. ***P < 0.001 vs. shRNA-NC; #P < 0.05, ##P < 0.01, ###P < 0.001 vs. sh-INHBA-AS1-1+ inhibitor-NC. hHSFs, human hypertrophic scar fibroblasts; sh, short hairpin; NC, negative control; Col I, collagen I; Col III, collagen III; Col IV, collagen IV; α-SMA, alpha smooth muscle actin
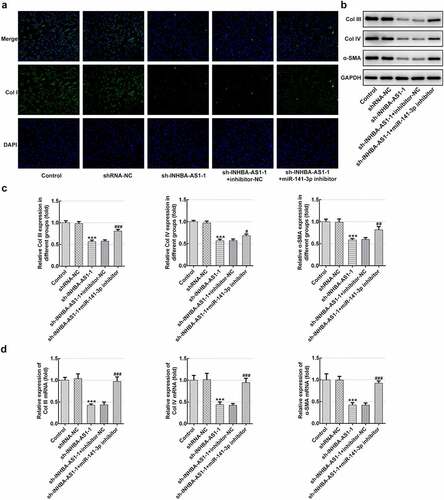
Figure 4. MCL1 is a direct target gene of miR-141-3p. (a) Binding region between miR-141-3p and MCL1. (b) MCL1 protein expression and (c) mRNA expression was tested using western blot analysis and RT-qPCR, respectively. ***P < 0.001 vs. CCC-ESF-1. (d) Relative luciferase activities were detected in hHSFs. ***P < 0.001 vs. mimic-NC+MCL1. (e) MCL1 protein level and (f) mRNA level were determined using western blot analysis and RT-qPCR, respectively. ***P < 0.001 vs. shRNA-NC; ##P < 0.01, ###P < 0.001 vs. sh-INHBA-AS1-1+ inhibitor-NC. hHSFs, human hypertrophic scar fibroblasts; sh, short hairpin; NC, negative control; WT, wild-type; MUT, mutant
Figure 5. MCL1-knockdown alleviates the proliferation and migration of hHSFs. MCL1 expression was examined using (a) western blot analysis and (b) RT-qPCR, respectively. (c) Cell viability was tested using a cell counting kit-8 assay. (d) Ki67 expression was evaluated using western blot analysis. (e) Representative images and (f) relative quantification of cell migration measured by wound healing assay at different time points. (g) Migration activity of hHSFs was assessed using transwell migration assay. (h) Number of migrated cells was quantified. **P < 0.01, ***P < 0.001 vs. sh-NC. hHSFs, human hypertrophic scar fibroblasts; sh, short hairpin; NC, negative control
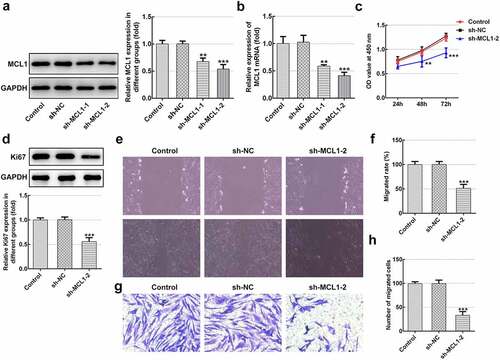
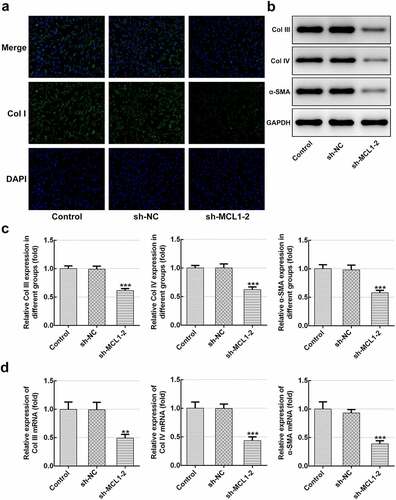
Figure 6. MCL1-knockdown mitigates the ECM deposition in hHSFs. (a) Expression of col I was detected using immunofluorescence assay. (b and c) The protein expression and (d) mRNA expression of Col III, Col IV and α-SMA were detected using western blot analysis and RT-qPCR, respectively. **P < 0.01, ***P < 0.001 vs. sh-NC.hHSFs, human hypertrophic scar fibroblasts; sh, short hairpin; NC, negative control; Col I, collagen I; Col III, collagen III; Col IV, collagen IV; α-SMA, alpha smooth muscle actin