
Figures & data
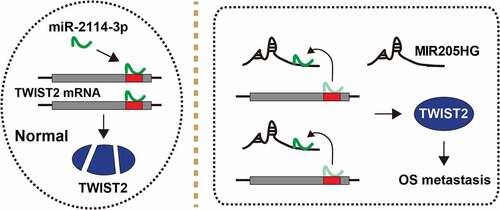
Figure 1. High MIR205HG is identified in human OS tissues. (a). qRT-PCR analysis of MIR205HG level in normal and OS tissues; OS-NM: non-metastatic OS tissues; OS-M: metastatic OS tissues. (b, c). The survival curve of OS patients based on median MIR205HG level. (d–f). qRT-PCR analysis and FISH assay testing the subcellular localization of MIR205HG in OS cells. **P< 0.01, ***P< 0.001
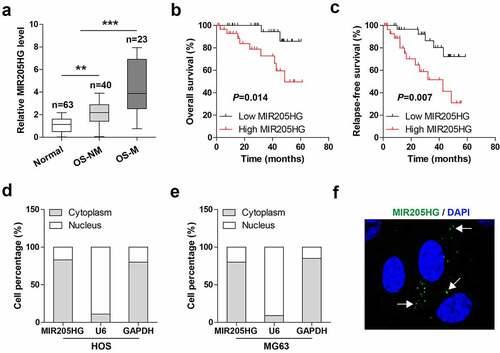
Figure 2. MIR205HG knockdown represses cell invasion and metastasis. (a). qRT-PCR analysis of MIR205HG levels in OS cells after infection with lentiviral vector. (b, c). CCK-8 assay testing cell viability after MIR205HG silencing. (d, e). Transwell assay testing cell invasion after MIR205HG silencing. (f, g). Lung metastasis assay testing the effect of MIR205HG on OS cell metastasis in vivo. **P< 0.01
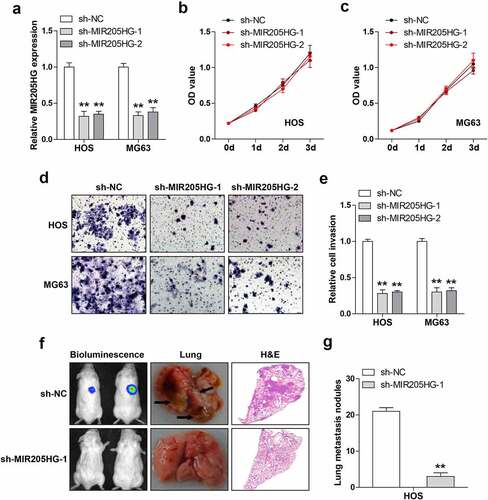
Figure 3. MIR205HG sponges miR-2114-3p. (a). RIP assay in OS cells with anti-Ago2 antibody, followed by qRT-PCR analysis of MIR205HG and GAPDH enrichment. (b,c). RNA pull-down assay using biotin-labeled MIR205HG/miR-2114-3p probe, followed by qRT-PCR analysis of relative enrichment. (d). Luciferase reporter assay detecting the binding of miR-2114-3p on MIR205HG. (e, f). qRT-PCR analysis of miR-2114-3p/MIR205HG levels in MIR205HG-silenced/miR-2114-3p-overexpressed OS cells. (g). qRT-PCR analysis of miR-2114-3p in normal and OS tissues. H. The correlation between MIR205HG and miR-2114-3p in OS tissues. **P< 0.01, ***P< 0.001
Figure 4. MIR205HG elevates TWIST2 via miR-2114-3p. (a). Luciferase reporter assay detecting the binding of miR-2114-3p on TWIST2 3`-UTR. (b). RNA pull-down assay using biotin-labeled miR-2114-3p probe, followed by qRT-PCR analysis of relative enrichment. (c). qRT-PCR analysis of TWIST2 mRNA level in miR-2114-3p-overexpressed OS cells. (d). IF and IHC assays testing TWIST2 protein level in miR-2114-3p-overexpressed OS cells and metastatic lung tissues. (e). Western blot assay testing TWIST2 protein level in stable MIR205HG-silenced OS cells transfected with miR-2114-3p inhibitors. (f). qRT-PCR analysis of TWIST2 mRNA level in normal and OS tissues. (g). The correlation between MIR205HG and TWIST2 in OS tissues. (h). Transwell assay testing cell invasion in stable MIR205HG-silenced OS cells transfected with miR-2114-3p inhibitors or TWIST2-overexpressed vector. *P< 0.05, **P< 0.01, ***P< 0.001
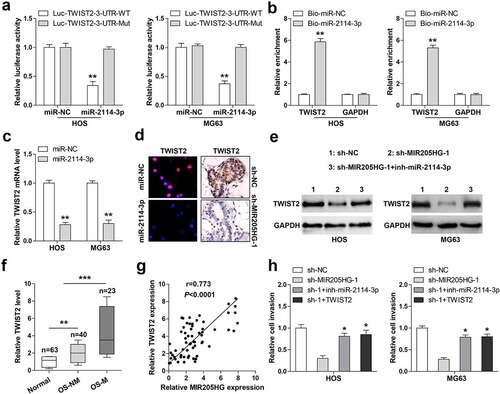
Figure 5. The schematic diagram of the action of MIR205HG in OS. In normal cells, miR-2114-3p binds to TWIST2 mRNA 3`-UTR, resulting in decreased TWIST2 level; In OS cells, MIR205HG sponges miR-2114-3p, antagonizing the inhibitory effect of miR-2114-3p on TWIST2, thereby increasing TWIST2 expression and subsequently promoting OS metastasis

Supplemental Material
Download ()Availability of data and material
The datasets used and/or analysed for the current study are available from the corresponding author upon reasonable request.