Figures & data
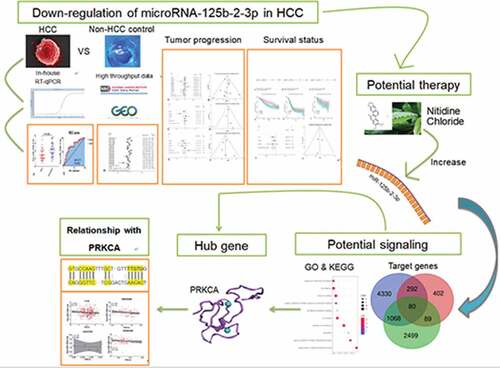
Figure 1. The expression of miR-125b-2-3p in HCC and non-tumor tissue based on in-house RT-qPCR. MiR-125b-2-3p was lowly expressed in HCC tissue compared to non-tumorous liver tissue. (b) The ROC curve of miR-125b-2-3p in HCC
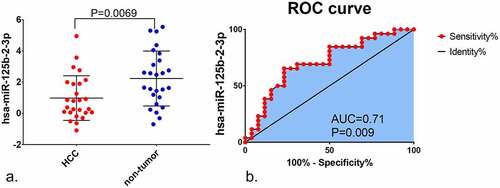
Figure 2. An integrative analysis of miR-125b-2-3p in HCC and non-tumor tissue. (a) Combined with a series of studies, the expression trend of miR-125b-2-3p in HCC and non-tumor tissue was shown by forest plot. A random effects model was used. (b) SROC curves of miR-125b-2-3p based on the integrative studies. The numbers in the figure were: 1) E-MTAB-4170. 2) GSE21362. 3) GSE36915. 4) GSE39678. 5) GSE40744. 6) GSE41874. 7) GSE53992. 8) GSE57555. 9) GSE59856. 10) GSE64632. 11) GSE69580. 12) GSE74618. 13) GSE75283. 14) GSE85589. 15) GSE98269. 16) GSE98406. 17) GSE108724. 18) GSE112264. 19) GSE115016. 20) GSE147889. 21) RT-qPCR. 22) TCGA
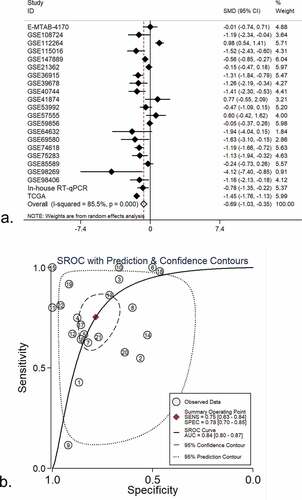
Figure 3. (a) An integrative analysis of miR-125b-2-3p based on gender group. MiR-125b-2-3p was lowly-expressed in female group. (b) Funnel plot of gender group. (c) An integrative analysis of miR-125b-2-3p based on tumor grade. MiR-125b-2-3p was lowly-expressed in poorly differentiated HCC tissue. (d) Funnel plot of grade group. (e) An integrative analysis of miR-125b-2-3p based on TNM stage. MiR-125b-2-3p was lowly-expressed in advanced TNM stages. (f) Funnel plot of TNM stage group
Figure 4. The prognostic value of miR-125b-2-3p in HCC, the COX regression, K-M plots and SMD were performed. (a-c) COX regression analysis of miR-125b-2-3p in TCGA, GSE10694 and GSE116182. (d-f) K-M plots were performed for TCGA, GSE10694 and GSE116182 respectively. (g) The forest plot was drawn based on the HR. The experimental group was high-expressed miR-125b-2-3p group and the high-expressed miR-125b-2-3p was indicated a great prognosis in HCC. (h) the funnel plot of HR
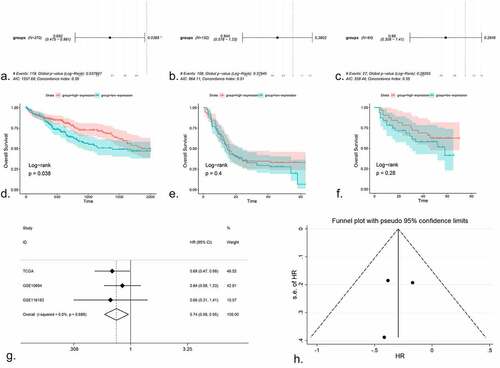
Figure 5. (a) The volcano plot of miRNAs in HCC cell line. After NC treatment, the expression of miR-125b-2-3p was higher than in control group. (b) The KEGG pathway analysis was performed for the target genes of miR-125b-2-3p. Different colors indicated different terms. (c) The PPI network for all the genes enriched in KEGG pathways. (d) The volcano plot of mRNAs in HCC cell line. Hub gene PRKCA was low-expressed in HCC cell line after NC treatment. (e) The complementary sequence between miR-125b-2-3p and PRKCA. (f) An integrative analysis of correlation analysis between miR-125b-2-3p and PRKCA
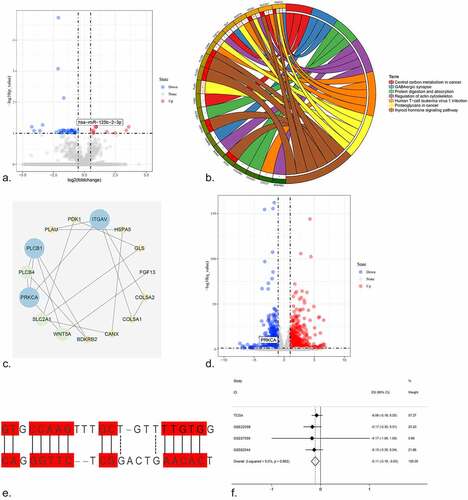
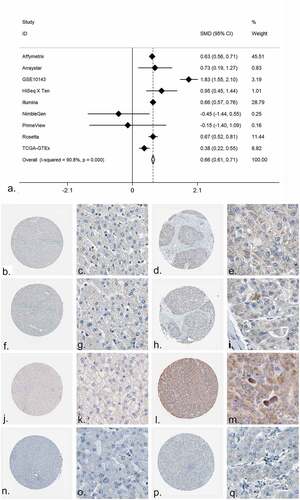
Figure 6. The expression of PRKCA in HCC. (a) An integrative analysis of PRKCA expression in HCC. (b-q) The immunohistochemistry profiles of PRKCA in HCC and normal liver tissue based on multiple antibodies. B-E): PRKCA stained in normal liver tissue and HCC by antibody HPA006563. B: ×40, C: ×400, D: ×40, E:×400. F-I): PRKCA stained in normal liver tissue and HCC by antibody HPA006564. F: ×40, G: ×400, H: ×40, I:×400. J-M): PRKCA stained in normal liver tissue and HCC by antibody CAB003844. J: ×40, K: ×400, L: ×40, M:×400. N-Q): PRKCA stained in normal liver tissue and HCC by antibody CAB016290