
Figures & data
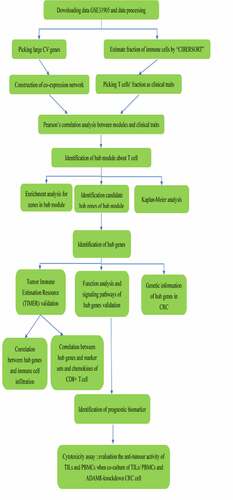
Figure 1. Construction of WGCNA analysis
Notes: (a) Analysis of connectivity distribution and scale-free topological histogram of different soft threshold power (β). (b) Hierarchical clustering grouped genes into various modules and different colors represent different modules. (c) Heatmap shows correlations of module-related genes and T-cell infiltration. (d) A scatter plot of gene significance (GS) for T cells gamma delta vs. module membership (MM) in the blue module.Abbreviations: WGCNA, weighted gene co-expression network analysis
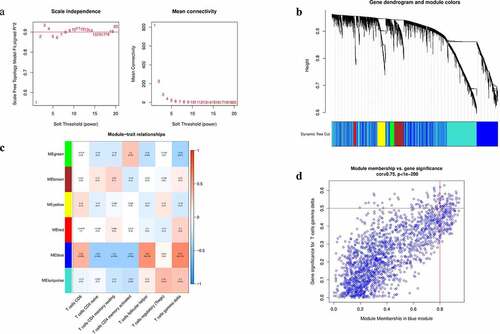
Figure 2. The enrichment analysis of hub module
Notes: (a) The top 20 enrichment terms are displayed as a bar chart. (b) The network diagram of GO biological processes is constructed as a node. Nodes with the same color share the same cluster ID.Abbreviations: GO, Gene Ontology
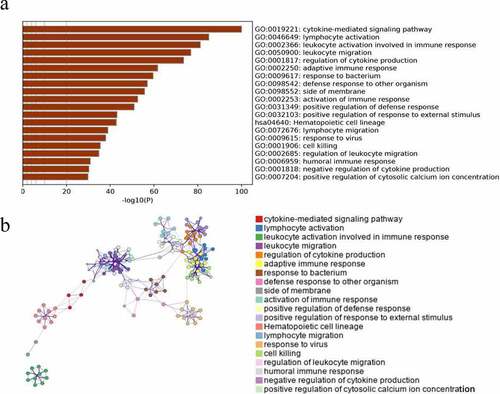
Figure 3. Identification of hub genes
Notes: Survival analysis. (a) ADAM8 (P = 2.107e-02) was associated with prognosis in CRC. (b) IL-1A (P = 4.162e-02) was associated with prognosis in CRC. (c) VAV3 (P = 2.255e-02) was associated with prognosis in CRC (high or low expression, n = 233).Abbreviations: CRC, colorectal cancer
Figure 4. Correlation between three expressed prognostic genes and immune cell infiltration through TIMER
Notes: The correlation between the abundance of six immune cell (B cells, CD4 + T cells, CD8 + T cells, neutrophils, macrophages, and dendritic cells) and the expression of (a) ADAM8, (b) IL-1A, (c) VAV3. The purity-corrected partial Spearman correlation and statistical significance are displayed in the upper right corner.
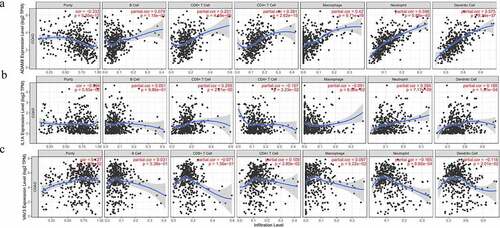
Figure 5. Genetic Alteration of hub genes in CRC
Notes: ADAM8 (alteration rate 8%), IL-1A (alteration rate 4%) and VAV3 (alteration rate 9%) genetic alterations in TCGA CRC patients.Abbreviations: TCGA, The Cancer Genome Atlas; CRC, colorectal cancer
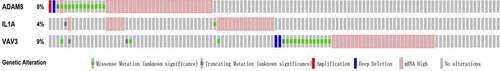
Figure 6. Co-expression Genes correlated with hub genes in CRC
Notes: Gene expression heat map for ADAM8, IL-1A and VAV3 co-expressed genes as well as co-expression correlation. The top five significant gene sets positively and negatively correlated with ADAM8 are shown in the circos and heatmap (a and d). The top five significant gene sets positively and negatively correlated with IL-1A are shown in the circos and heatmap (b and e). The top 5 significant gene sets positively and negatively correlated with VAV3 are shown in the circos and heatmap (c and f). Red color represented a positive correlation, while green shows a negative correlation.
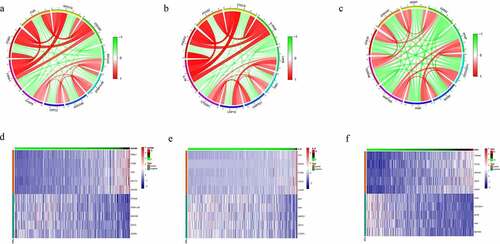
Figure 7. Function analysis and signaling pathways of hub genes
Notes: Biological function changes of different samples between the high and low ADAM8, IL-1A and VAV3 expression groups. (a, b and c) Barplot of GSVA results.Abbreviations: GSVA, Gene Set Variation Analysis
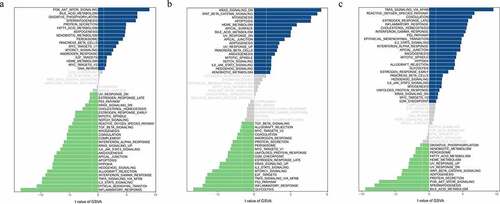
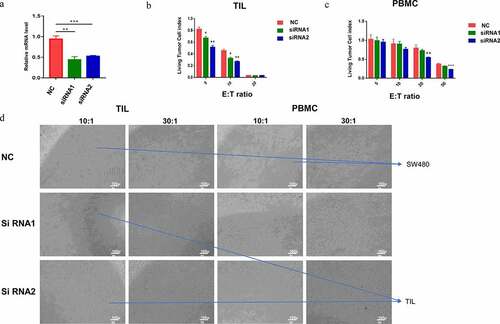
Figure 8. Functional experiments of ADAM8
Notes: (a) RT-quantitative PCR analysis of ADAM8 mRNA expression levels upon using siRNA transfection to knock down ADAM8. The mRNA expression level of ADAM8 was downregulated. (b and c) SW480 cells were used as target cells to evaluate the cytotoxic potential of 5:1, 10:1, 20:1, 50:1 TILs or PBMCs. PBMCs or TILs were co-cultured with different treatment tumor cells for 48 h. Cell Counting Kit 8 was then performed to measure cell growth viability. (d) Cells were observed under a confocal microscope after co-cultured for 48 h. * P < 0.05, ** P < 0.01, *** P < 0.001. Abbreviations: TILs, tumor-infiltrating lymphocytes; PBMCs, peripheral blood mononuclear cells
Supplemental material
Supplemental Material
Download ()Data availability statement
Data subject to third-party restrictions. The data were obtained from TCGA(https://tcga-data.nci.nih.gov/tcga/).