Figures & data
Figure 1. Overexpression of circ_0062582 promoted the osteogenic differentiation of hBMSCs. (a) Expression levels of circ_0062582 in hBMSCs was detected by RT-qPCR analysis. (b) Detection of the expression of circ_0062582 following addition of pcDNA-circ_0062582. (c) Viability of hBMSCs was measured using CCK-8 assay. (d) Alkaline phosphatase staining was used to detect the differentiation activity of hBMSCs. Magnification, x200. (e) Alizarin red staining was used to detect the mineralization levels of hBMSCs. Magnification, x200. (f) Protein expression levels of OSX, OCN and COL1 were tested by means of western blot assay. **P < 0.01 and ***P < 0.001. hBMSCs, human bone marrow mesenchymal stem cells; circ, circular RNA; OSX, osterix; OCN, osteocalcin; COL1, collagen type 1
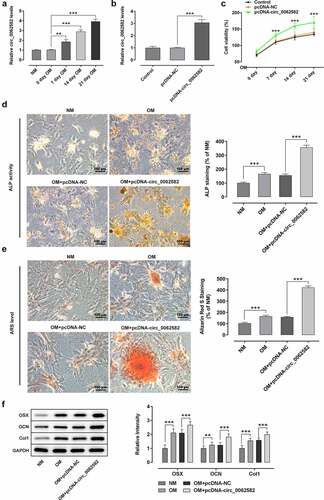
Figure 2. Overexpression of miR-145 suppressed the promotion effect of circ_0062582 on the osteogenic differentiation of hBMSCs. (a) Prediction of target genes. (b) MiR-145 expression was tested with RT-qPCR after transfection with miR-145 mimic. (c) Results of the Promega dual-luciferase reporter gene assay. (d) Expression of miR-145 in hBMSCs was examined using RT-qPCR. (e) The expression of miR-145 was evaluated with RT-qPCR after cells being induced by OM. (f) Detection of the expression levels of circ_0062582 following transfection with miR-145 mimic. ***P < 0.001. (g) Viability of hBMSCs. ***P < 0.001 vs. OM+pcDNA-NC and ###P < 0.001 vs. OM+pcDNA-circ_0062582+ miR-NC. (h) Alkaline phosphatase staining was used to detect the differentiation activity of hBMSCs. Magnification, x200. (i) Alizarin red staining was employed to evaluate the mineralization levels of hBMSCs. Magnification, x200. (j) Protein expression levels of OSX, OCN and COL1 were measured using western blot analysis. ***P < 0.001. miR-145, microRNA-145; hBMSCs, human bone marrow mesenchymal stem cells; OSX, osterix; OCN, osteocalcin; COL1, collagen type 1
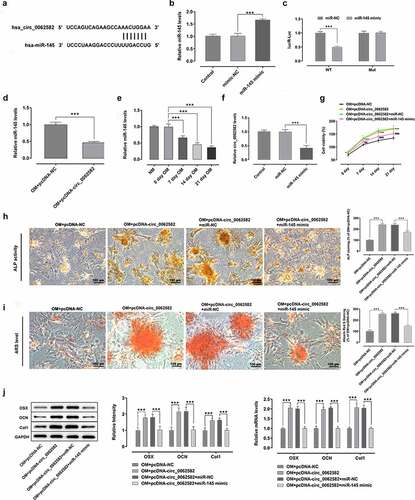
Figure 3. CBFB was a direct target gene of miR-145 in hBMSCs. (a) Prediction of target genes. (b) Results of the Promega dual-luciferase reporter gene assay. (c) Detection of the expression of CBFB following transfection with miR-145 mimic. (d) Protein expression of CBFB was evaluated by western blot analysis. (e) Expression of CBFB in hBMSCs was detected by RT-qPCR. *P < 0.05, **P < 0.01 and ***P < 0.001. CBFB, core-binding factor subunit β; miR-145, microRNA-145
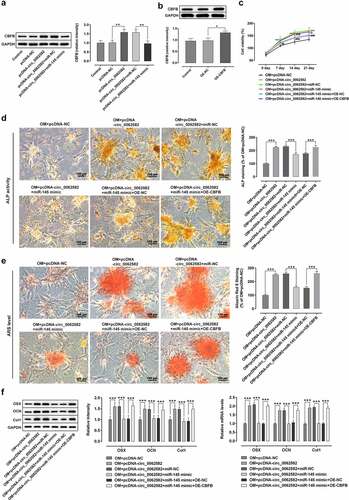
Figure 4. Effect of circ_0062582 on the osteogenic differentiation of hBMSCs by regulating miR-145/CBFB pathway. (a) Expression levels of CBFB in hBMSCs. (b) Expression levels of CBFB in hBMSCs following transfection with the CBFB overexpression vector. *P < 0.05, **P < 0.01. (c) Viability of hBMSCs. ***P < 0.001 vs. OM+pcDNA-NC; ##P < 0.01 and ###p < 0.001 vs. OM+pcDNA-circ_0062582+ miR-NC