
Figures & data
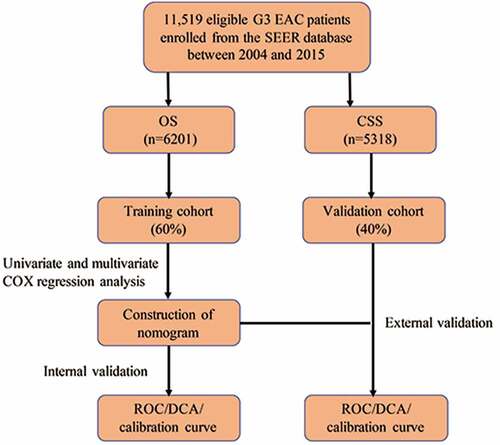
Table 1. Clinical information of OS cohort
Table 2. Clinical information of CSS cohort
Figure 1. Flow chart of analysis
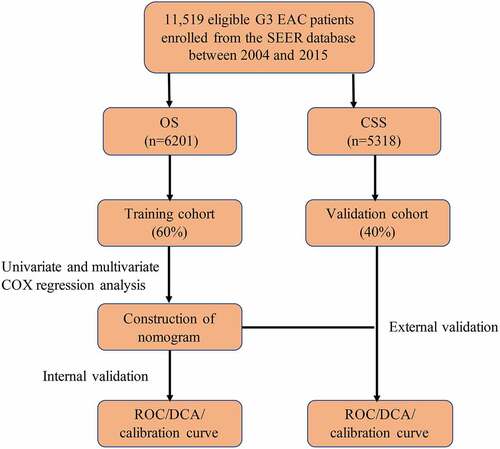
Table 3. Univariate and multivariate cox analysis in OS
Table 4. Univariate and multivariate cox analysis in CSS
Figure 2. OS survival curves in patients with G3 EACs
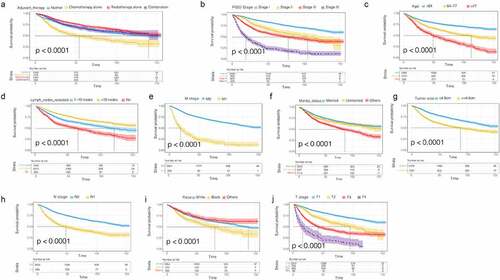
Figure 3. CSS survival curves in patients with G3 EACs
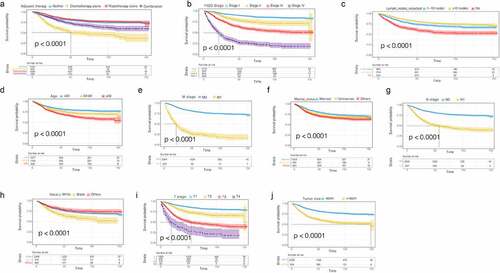
Figure 4. (a): The OS nomogram model. (b): The CSS nomogram model
Figure 5. (a): OS calibration diagram in the training set. (b): CSS calibration diagram in the training set. (c): OS calibration diagram in the validation set. (d): CSS calibration diagram in the validation set
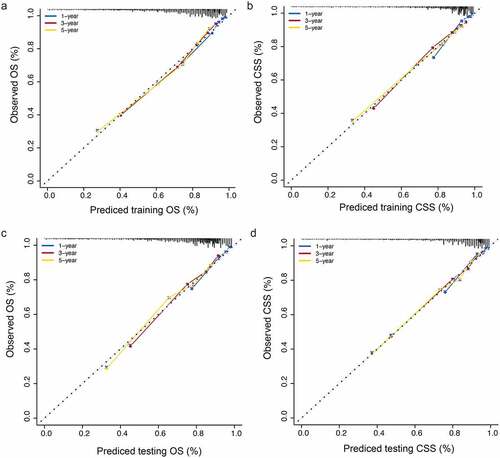
Figure 6. Clinical utility of the nomogram models in the training set. (a–c): ROC curve of each model at 1, 3, and 5 years (OS). (d–f): DCA curve of each model at 1, 3, and 5 years (OS)
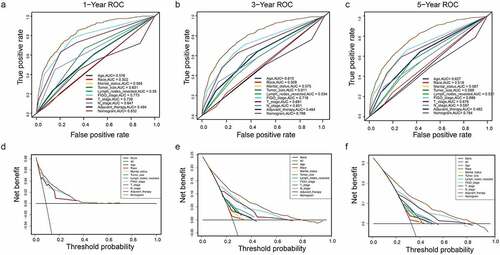
Figure 7. (a–c): ROC curve of each model at 1, 3, and 5 years (CSS). (d–f): DCA curve of each model at 1, 3, and 5 years (CSS)
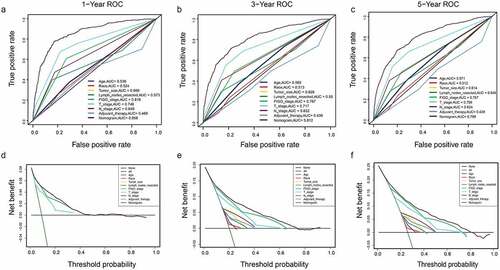
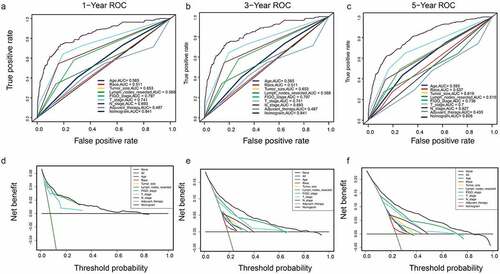
Figure 8. Clinical utility of the nomogram models in the validation set. (a–c): ROC curve of each model at 1, 3, and 5 years (OS). (d–f): DCA curve of each model at 1, 3, and 5 years (OS)
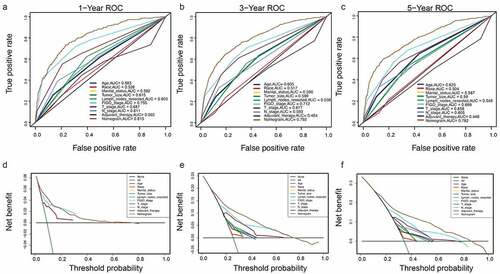
Figure 9. (a–c): ROC curve of each model at 1, 3, and 5 years (CSS). (d–f): DCA curve of each model at 1, 3, and 5 years (CSS)
Supplemental Material
Download ()Data availability statement
Some or all data, or code generated or used during the study are available from the corresponding author by request.