
Figures & data
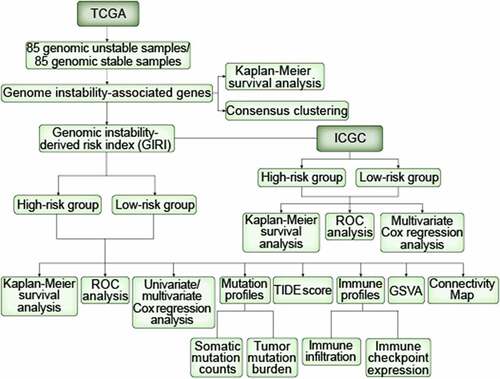
Figure 1. Differentiation of GAGs-based molecular characteristic clusters of ccRCC. GAGs, genomic instability-associated genes. ccRCC, clear cell renal cell carcinoma. (a) Kaplan-Meier survival curves of the genomic stable (GS) group and the genomic unstable (GU) group. (b) Consensus CDF. (c) Consensus clustering matrix of 337 TCGA samples for k= 2. The samples were grouped into the genomic stable (GS)-like group and the genomic unstable (GU)-like group. (d) Kaplan-Meier survival curves of subclasses in consensus clustering. (e) Heatmap characterized by subclass-specific genes
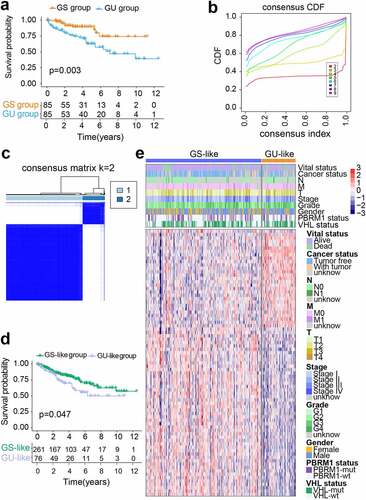
Table 1. Multivariate Cox regression analysis
Figure 2. Construction of genomic instability-derived risk index (GIRI) for patients with ccRCC in the training set. (a) Kaplan-Meier survival plot of the high-risk GIRI and the low-risk GIRI. (b) Comparison of time-dependent receiver operating characteristic curves among the GIRI, age, gender, tumor grade, and clinical stage. (c) Expression characteristics of genes. (d) Distribution of GIRI and vital status
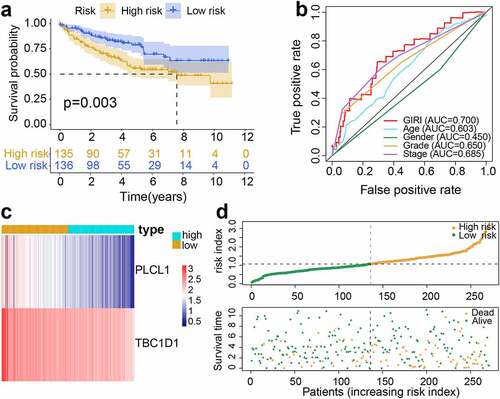
Table 2. Univariate and Multivariate Cox regression analysis of the correlation of GIRI with OS among TCGA patients
Figure 3. Performance validation of genomic instability-derived risk index (GIRI). Kaplan-Meier survival plot of the high-risk GIRI and the low-risk GIRI in the test set (a) and the entire set (d). Comparison of time-dependent receiver operating characteristic curves among the GIRI, age, gender, tumor grade, and clinical stage in the test set (b) and the entire set (e). Distribution characteristics of gene expression, GIRI, and vital status between high-risk and low-risk groups in the test set (c) and the entire set (f)
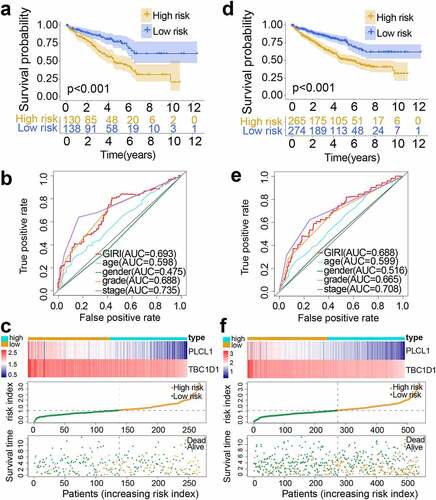
Figure 4. Stratified survival analysis of genomic instability-derived risk index (GIRI) subtypes in different clinical subgroups. Samples were classified according to age (a), gender (b), tumor grade (c), clinical stage (d), PBRM1 status (e), and VHL status (f). PBRM1, polybromo 1. VHL, von Hippel-Lindau tumor suppressor
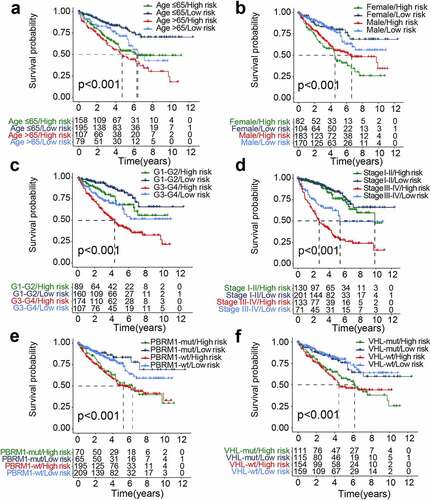
Figure 5. The differential distribution of the genomic instability-derived risk index (GIRI) in each clinical subgroup. TCGA samples stratified by genomic instability-associated subclasses (a), age (b), tumor grade (c), clinical stage (d), Tclassification (e), Nclassification (f), Mclassification (g), vital status (h), and cancer status (i)
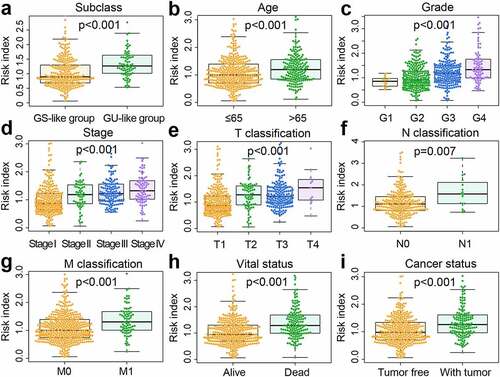
Figure 6. The differential distribution of prognosis-associated clinical features in the risk subgroups. (a) Differences in clinicopathological characteristics and expression of highly mutated genes in TCGA samples. TCGA, The Cancer Genome Atlas. (b) Differences in clinicopathological characteristics and expression of highly mutated genes in ICGC samples. ICGC, International Cancer Genome Consortium. The statistical p-value was derived from the chi-square test
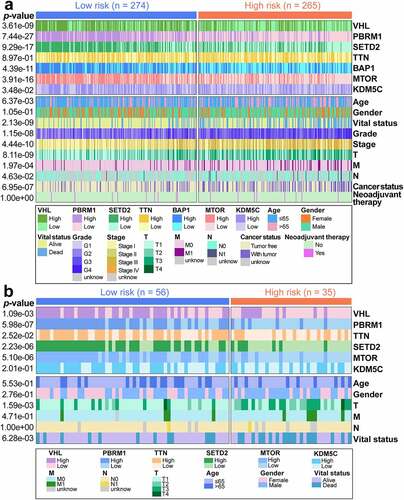
Figure 7. Immunity-associated landscapes of TCGA samples. (a) Boxplot of immune scores for risk subgroups. (b) Tumor-infiltrating immune cells with different infiltration abundance in the risk subgroups. (c) Kaplan-Meier survival analysis of low and high TMB patients. TMB, tumor mutation burden. (d) The positive correlation between GIRI and TMB was characterized by Spearman correlation analysis. GIRI, genomic instability-derived risk index. (e) Stratified survival analysis of GIRI subtypes in TMB subgroups. (f) Differentially expressed immune checkpoint molecules in the risk subgroups. *p< 0.05, **p< 0.01, ***p< 0.001. TIDE score (g), MSI score (h), Tcell exclusion score (i), and Tcell dysfunction score (j) between high-risk and low-risk groups. TIDE, tumor immune dysfunction and exclusion. MSI, microsatellite instability
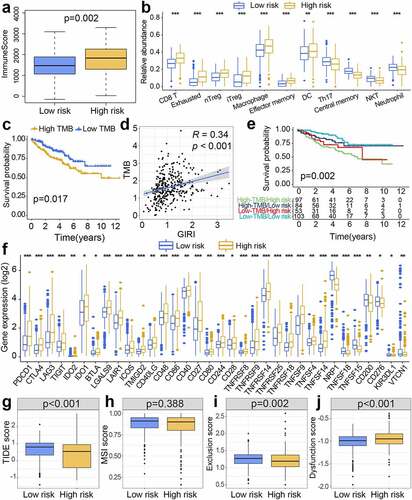
Figure 8. Gene set variation analysis (GSVA) and prognostic analysis of genes. (a) Heatmap of subgroup-specific KEGG biological pathways. The statistically adjusted p-value was derived from limma’s t-test. KEGG, Kyoto Encyclopedia of Genes and Genomes. (b) Kaplan-Meier survival analysis of different expression levels of TBC1D1 and PLCL1 in the TCGA dataset. TCGA, The Cancer Genome Atlas. (c) Kaplan-Meier survival analysis of different expression levels of TBC1D1 and PLCL1 in the ICGC dataset. ICGC, International Cancer Genome Consortium. The differential levels of gene expression stratified by age (d), tumor grade (e), and clinical stage (f). *p< 0.05, **p< 0.01, ***p< 0.001
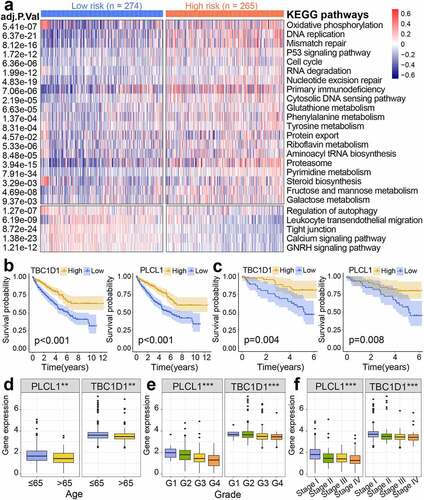
Figure 9. Prediction of potential drugs for risk subgroups
Data availability statements
The data associated with this manuscript can be downloaded from The Cancer Genome Atlas database (TCGA, https://portal.gdc.cancer.gov/) and International Cancer Genome Consortium (ICGC, https://dcc.icgc.org/).