
Figures & data
Table 1. Clinicopathological features of healthy pregnant women and women with PE
Table 2. Primer design
Figure 1. δ-TT induces the apoptosis in trophoblasts and inhibits their proliferation. (a) CCK-8 assay to test cell viability. (b) CCK-8 to examine cell proliferation. (c) Flow cytometry to detect cell cycle. (d) Flow cytometry to detect cell apoptosis. (e) The expression of cyclin D1, cleaved-caspase-3 and cleaved caspase-9 measured by Western blotting. δ-TT, δ-tocotrienol. NS, non-significant, *P < 0.05, **P < 0.01 versus the control group
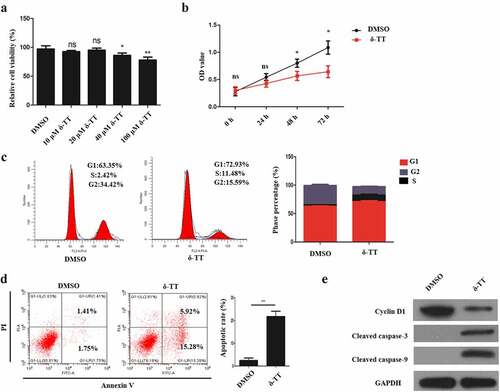
Figure 2. δ-TT inhibits the migration, invasion, EMT and angiogenesis in trophoblasts. (a) Wound healing assay to assess cell migration. (b) Transwell invasion assay to evaluate cell invasion. (c) Tube formation assay to examine angiogenesis. (d) The protein expression of MMP-2 and key epithelial-mesenchymal transition markers. δ-TT, δ-tocotrienol. ***P < 0.001 versus the control group
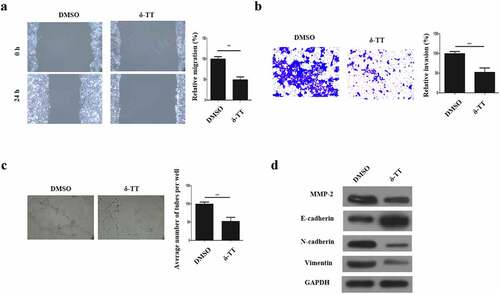
Figure 3. δ-TT exerts its toxic effects on trophoblasts via miR-429. (a) MiR-429 expression following δ-TT treatment. (b) MiR-429 expression after cells were transfected with miR-429 mimic and mimic negative control (NC). (c) Cell viability detected by CCK-8 assay. (d) Cell proliferation measured by CCK-8 assay. (e) Flow cytometry to assess cell cycle. (f and h) Flow cytometry to detect cell apoptosis. (g and i) The expression of cleaved-caspase-3 and cleaved caspase-9 measured by Western blotting. δ-TT, δ-tocotrienol. *P < 0.05, ***P < 0.001 versus the control group
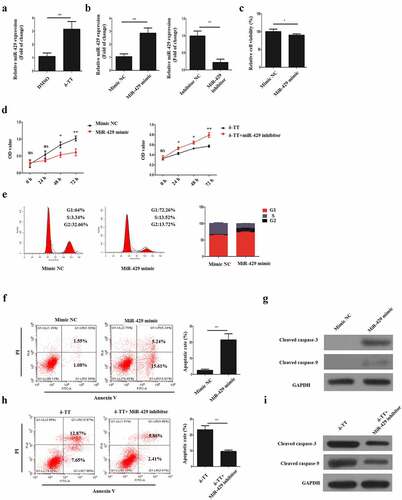
Figure 4. MiR-429 inhibits the migration, invasion, angiogenesis and EMT in trophoblasts. (a) Wound healing assay to assess cell migration. (b) Transwell invasion assay to evaluate cell invasion. (c) Tube formation assay to examine angiogenesis. (d) Immunohistochemistry to assess the expression of E-cadherin and vimentin in trophoblasts. δ-TT, δ-tocotrienol. *P < 0.05, ***P < 0.001 versus the control group
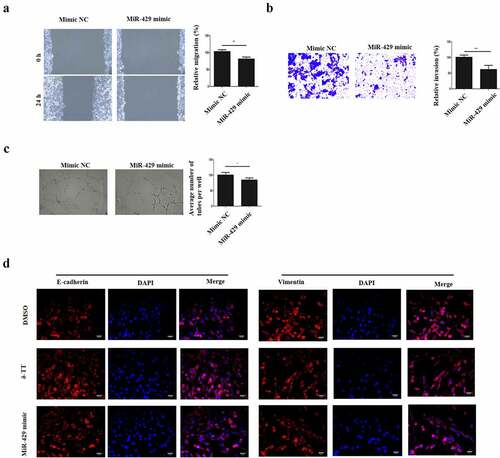
Figure 5. MiR-429 could bind ZEB1 directly. (a) The illustration of the complementary sequence between miR-429 and ZEB1. (b) ZEB1 expression in trophoblasts following δ-TT treatment. (c) The luciferase activity in wild-type luciferase constructs. (d) The luciferase activity in mutant-type luciferase constructs. (e) ZEB1 protein expression. (f) ZEB1 mRNA expression. (g) Flow cytometry to detect cell apoptosis. (h) Western blots for cleaved caspase-3 and cleaved caspase-9. δ-TT, δ-tocotrienol. NS, non-significant, **P < 0.01, ***P < 0.001 versus the control group
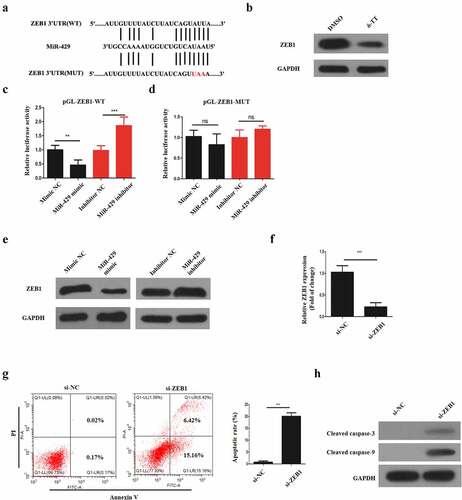
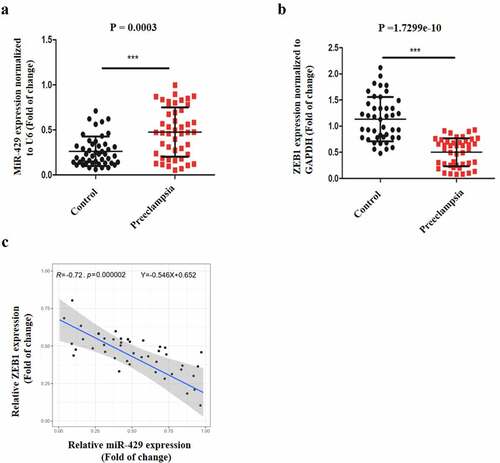
Figure 6. Clinical sample analysis. (a) MiR-429 expression normalized to U6 in normal and preeclamptic placentas. (b) ZEB1 expression normalized to GAPDH in normal and preeclamptic placentas. (c) The relationship between miR-429 and ZEB1 expression in preeclamptic placentas. **P < 0.01, ***P < 0.001 versus the control group
Availability of data and materials
The datasets used and/or analyzed during the present study are available from the corresponding author on reasonable request.