
Figures & data
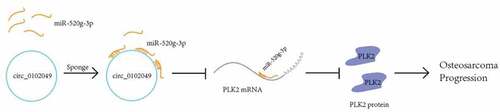
Figure 1. Silence of circ_0102049 promoted the tumorigenesis of OS by sponging miR-520g-3p. (a) The putative binding site between circ_0102049 and miR-520g-3p was predicted by using Targetscan software. (b) The enrichment fold of circ_0102049 was evaluated by RNA pull down assay by using biotin-labeled WT or MUT miR-520g-3p (n = 3). (c-e) Stable MG63 cells which were transfected with sh-circ_0102049, miR-520g-3p mimics, or co-transfected with sh-circ_0102049 and miR-520g-3p inhibitor, were subcutaneously inoculated into nude BALB/c nude mice (n = 6). (c) The representative image of xenograft tumor from different groups harvested at day 34. (d) Tumor volume from different groups was evaluated every three days for 34 days. (e) Tumor weight from different groups was evaluated at day 34. * P < 0.05, ** P < 0.01 and ns indicates no significant difference
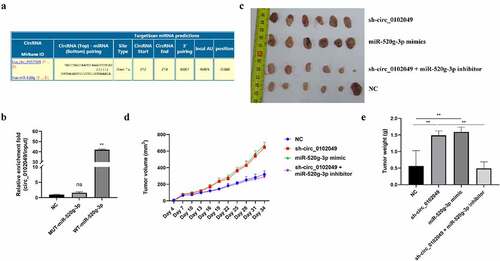
Figure 2. Silence of circ_0102049 suppressed the expression of TAp73 through targeting miR-520g-3p/PLK2 axis. (a) The putative binding site between miR-520g-3p and 3′ UTR of PLK2 was predicted by using Targetscan. (b) The enrichment fold of PLK2 was evaluated by RNA pull down assay by using biotin-labeled WT or MUT miR-520g-3p (n = 3). (c) The luciferase reporter plasmid containing WT or MUT 3′ UTR of PLK2 were co-transfected with miR-520g-3p mimics, miR-520g-3p inhibitor, or corresponding negative control (miR-NC and inhibitor NC) into MG63 cells, and the relative luciferase activity was evaluated by dual luciferase reporter system (n = 3). (d) MG63 cells were transfected with sh-circ_0102049, sh-NC, miR-520g-3p mimics, miR-NC, inhibitor NC, or co-transfected with sh-circ_0102049 and miR-520g-3p inhibitor. 48 h after transfection, the protein expression of PLK2 and TAp73 was evaluated by western blot (n = 3). * P < 0.05, ** P < 0.01 and ns indicates no significant difference
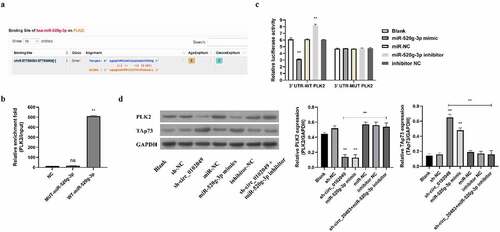
Figure 3. Silence of circ_0102049 promoted the growth, inhibited apoptosis, and promoted G2 phase arrest of MG63 cells through modulating miR-520g-3p/PLK2. MG63 cells were transfected with sh-circ_0102049, sh-NC, miR-520g-3p mimics, miR-NC, inhibitor NC, sh-circ_0102049 + miR-520g-3p inhibitor, sh-circ_0102049 + pc-PLK2 or miR-520g-3p mimics + pc-PLK2. (a) Cell proliferation was evaluated by CCK- assay. (b and c) Cell apoptosis (b) and cell cycle (c) was evaluated by flow cytometry. N = 3, * P < 0.05, ** P < 0.01 and no marks indicates no significant difference
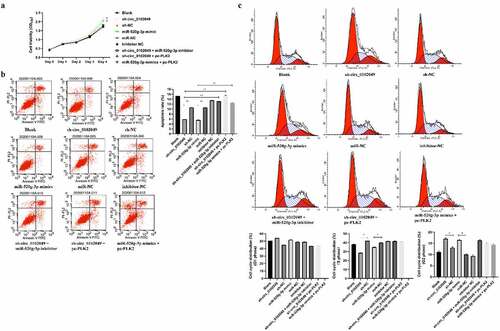
Figure 4. Silence of circ_0102049 promoted the invasion and migration of MG63 cells through targeting miR-520g-3p/PLK2 axis. MG63 cells were transfected with sh-circ_0102049, sh-NC, miR-520g-3p mimics, miR-NC, inhibitor NC, sh-circ_0102049 + miR-520g-3p inhibitor, sh-circ_0102049 + pc-PLK2 or miR-520g-3p mimics + pc-PLK2. The migration (a) and invasion (b) of MG63 cells was evaluated by Transwell assay. Bar: 50 μM, N = 3, ** P < 0.01 and no marks indicates no significant difference
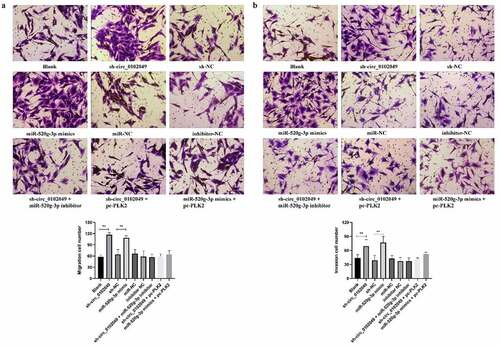
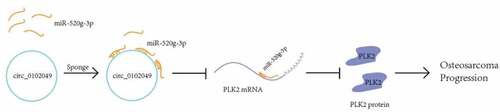
Figure 5. A schematic diagram to summarize the interactions discovered in this study
Data availability statement
The data of this study are available from the corresponding author upon reasonable request.