
Figures & data
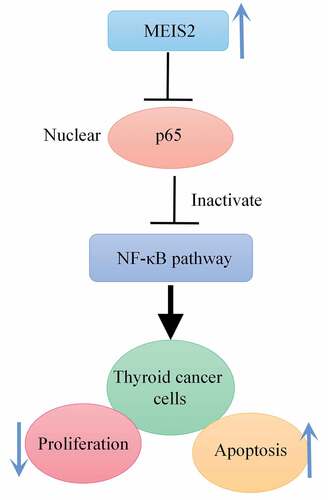
Figure 1. Down-regulation of MEIS2 in thyroid cancer
A. Expression of MEIS2 in thyroid cancer and normal tissues in TCGA database; B. Assessment of MEIS2 mRNA expression in cells using qRT-PCR; C. Evaluation of MEIS2 protein expression in cells using western blot. *P < 0.05, **P < 0.01 and ***P < 0.001 vs. Nthy-ori 3–1 group.
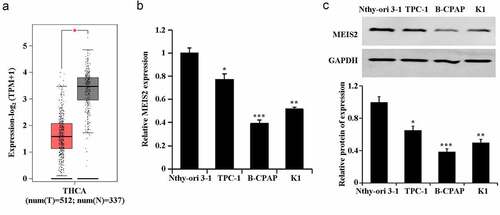
Figure 2. Inhibition of B-CPAP cell proliferation by MEIS2
A. Determination of MEIS2 mRNA expression in cells using qRT-PCR; B. Assessment of MEIS2 protein expression in cells using western blot; C. Evaluation of cell proliferation utilizing CCK-8; D. Indication of cell viability utilizing colony formation assay. *P < 0.05 and **P < 0.01 vs. NC vector group; #P < 0.05, ##P < 0.01 and ###P < 0.001 vs. sh-NC group.
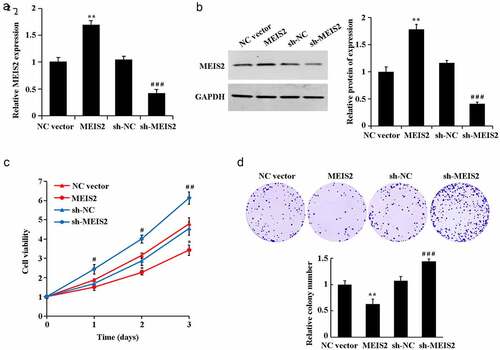
Figure 3. MEIS2 promotes apoptosis and inhibits cell cycle progression in B-CPAP cells
Determination of cell cycle (A) and apoptosis rate (B) by flow cytometry. *P < 0.05 and **P < 0.01 vs. NC vector group; #P < 0.05 and ##P < 0.01 vs.sh-NC group.
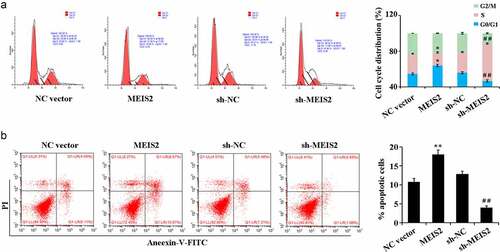
Figure 4. MEIS2 inhibits NF-κB signaling pathway activity in B-CPAP cells
Assessment of the expression of p65 in the cytoplasm (A) in and p65 in the nucleus (B) in B-CPAP cells by western blot, and the quantification results (C). **P < 0.01 vs. NC vector group; ##P < 0.001 vs. sh-NC group.
Supplemental material