
Figures & data
Figure 1. The expression of m6A-long noncoding RNAs (lncRNAs) and their role in the prognosis of hepatocellular carcinoma patients
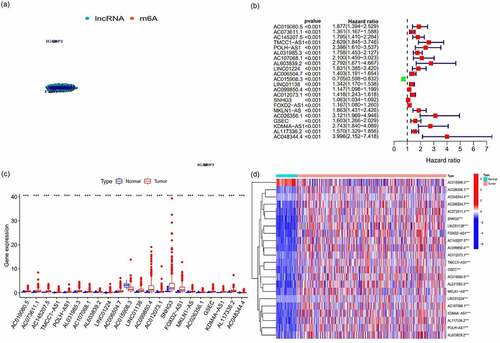
Figure 2. The expression and relationship of m6A prognostic long noncoding RNAs (lncRNAs) and target gene
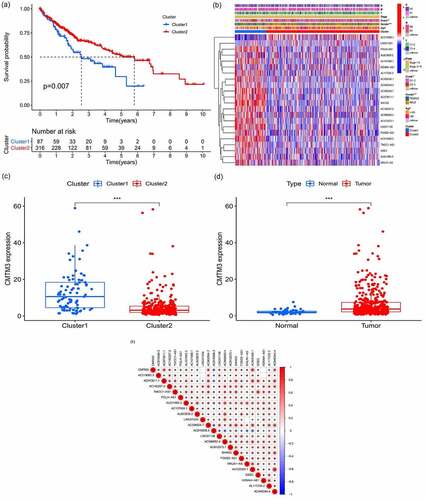
Figure 3. Analysis of immune cell infiltration and the tumor microenvironment
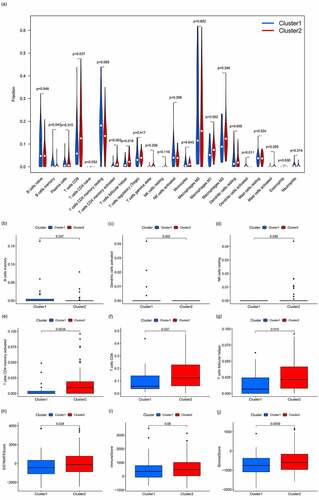
Figure 4. Gene set enrichment analysis
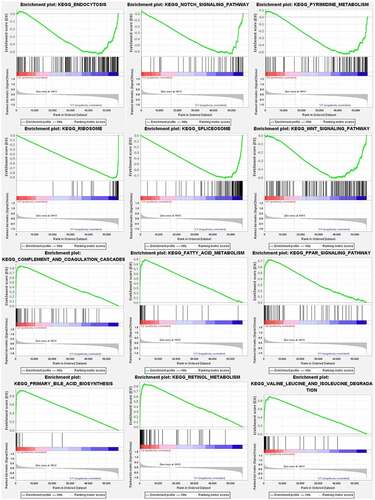
Figure 5. Prognostic model and its influence on the prognosis of HCC patients
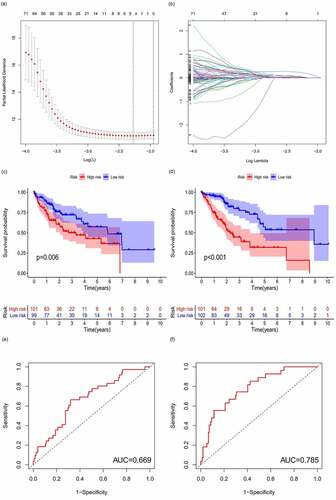
Figure 6. m6A-lncRNA-related risk score and its influence on the prognosis of HCC patients
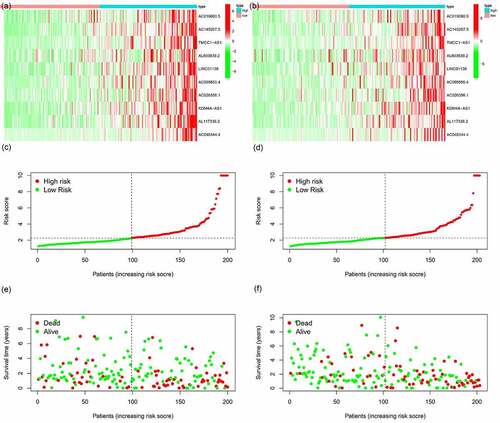
Figure 7. Multivariate and univariate analyses of independent prognostic analysis
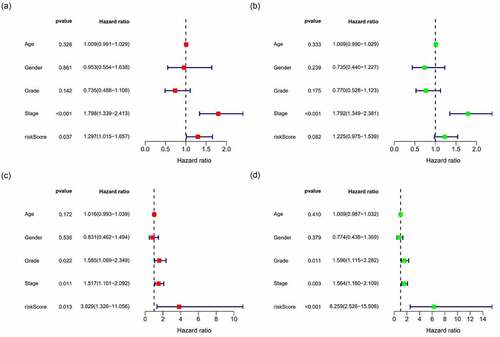
Figure 8. Survival curve for model validation
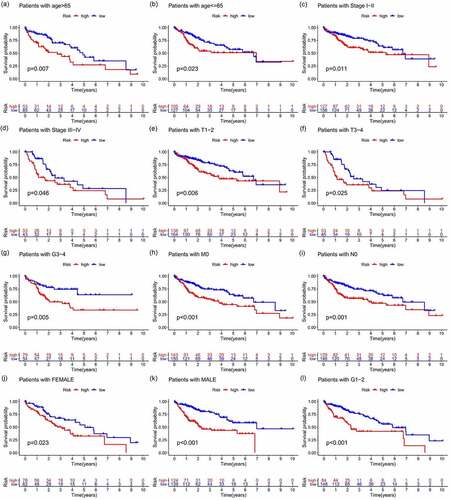
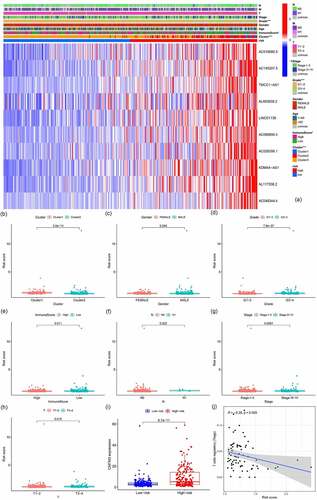
Figure 9. Correlation analysis of risk, immune cells, and clinical and genetic differences analysis of the target gene
Supplemental Material
Download ()Data availability statement
The dataset supporting the conclusions of this article is available upon reasonable request from The Cancer Genome Atlas. https://portal.gdc.cancer.gov/