Figures & data
Table 1. Correlation of miR-92a-3p expression with multiple clinicopathological features in BC patients
Table 2. Sequences used for qRT-PCR
Figure 1. MiR-92a-3p is highly expressed in BC cells and tissues (a) Detection by qRT-PCR of relative miR-92a-3p expression in 60 adjacent normal tissues (normal) and 60 BC tissues (tumor). (b) Detection by qRT-PCR of relative miR-92a-3p expression in four kinds of BC cells (MCF-7, MDA-MB-231, BT549 and BT474) and normal breast epithelial cell line (MCF-10A). (c and d). MiR-92a-3p inhibitors (50 nM) or miR in (50 nM) and miR-92a-3p mimics (50 nM) or miR NC (50 nM) were transfected into MCF-7 or BT549 cells, respectively. And qRT-PCR was conducted to detect relative miR-92a-3p expression in MCF-7 and BT549 cells after the transfection
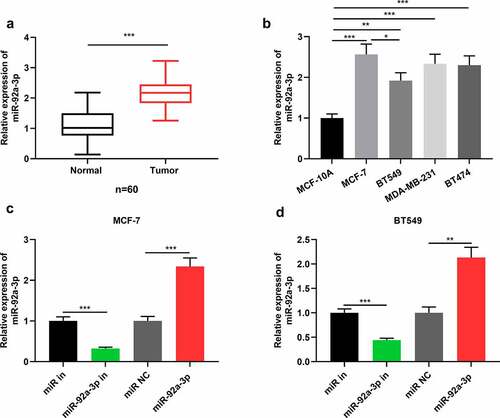
Figure 2. MiR-92a-3p promotes BC cell proliferation and metastasis (a) The proliferation of BT549 and MCF-7 cells transfected with 50 nM miR-92a-3p mimics (or 50 nM miR NC) and 50 nM miR-92a-3p inhibitors (or 50 nM miR in) was detected by CCK-8 assay. (b) Western blot was utilized for examining the expression levels of apoptosis-related proteins (Bcl-2/Bax) in BT549 and MCF-7 cells transfected with 50 nM miR-92a-3p mimics (or 50 nM miR NC) and 50 nM miR-92a-3p inhibitors (or 50 nM miR in). (c and d). Transwell assays were employed for detecting the invasion and migration of BT549 and MCF-7 cells transfected with 50 nM miR-92a-3p mimics (or 50 nM miR NC) and 50 nM miR-92a-3p inhibitors (or 50 nM miR in)
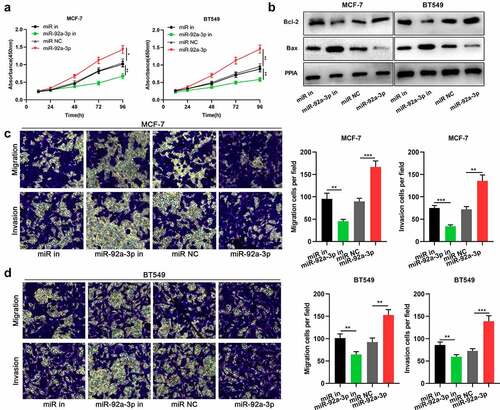
Figure 3. BTG2 is a miR-92a-3p target (a) The binding sequence of miR-92a-3p with BTG2 was predicted through Bioinformatics analysis. (b) Pearson correlation analysis was conducted to analyze the correlation between miR-92a-3p expression and BTG2 mRNA expression in 60 BC tissues. (c) Dual-luciferase reporter gene assay was utilized for detecting the luciferase activity of BTG2 3ʹUTR WT or MUT after miR-92a-3p was overexpressed. D and E. Western blot and qRT-PCR were carried out to examine BTG2 mRNA and protein expressions in BT549 and MCF-7 cells with transfection of 50 nM miR-92a-3p mimics (or 50 nM miR NC) and 50 nM miR-92a-3p inhibitors (or 50 nM miR in)
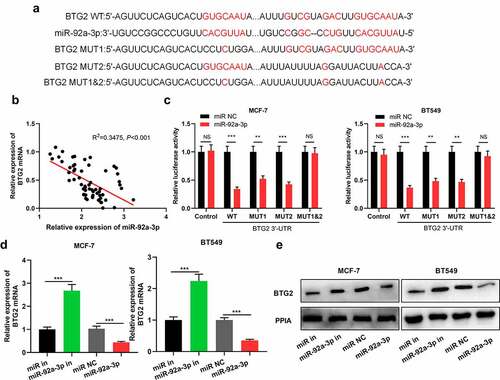
Figure 4. BTG2 is lowly expressed in BC (a) IHC was adopted to examine BTG2 expression in para-cancerous tissues and cancerous tissues. (b) The strongly positive, weakly positive and negative expression rates of BTG2 in adjacent tissues and BC tissues were obtained through statistics. (c) Western blot was performed to detect BTG2 expression in BC cells (MDA-MB-231, BT549, MCF-7 and BT474) and normal breast epithelial cell line MCF-10A. (d). BTG2 mRNA expression in adjacent normal tissues (normal) and BC tissues (tumor) was examined by qRT-PCR
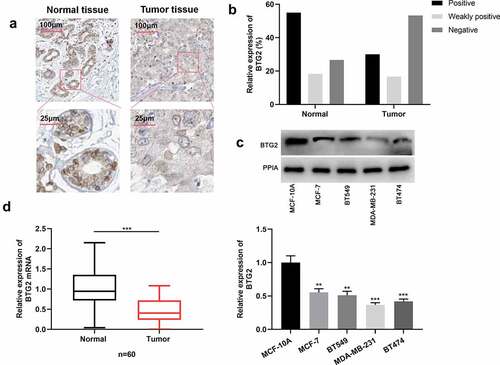
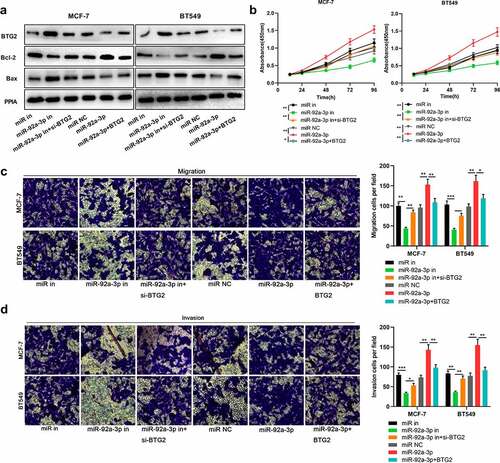
Figure 5. MiR-92a-3p/BTG2 axis participates in regulating BC cell metastasis and proliferation. 50 nM BTG2 siRNA (si-BTG2) and miR-92a-3p inhibitors were co-transfected into MCF-7 and BT549 cells, and BT549 and MCF-7 cells were also co-transfected with BTG2 overexpression plasmids and miR-92a-3p mimics.(a). BTG2, Bcl-2 and Bax protein expression in BT549 and MCF-7 cells was detected by Western blot, and PPIA protein served as the endogenous control. (b). CCK-8 assay was utilized for detecting MCF-7 and BT549 cells’ proliferation after co-transfection. (c and d). Transwell assays were employed for detecting BT549 and MCF-7 cells’ invasion and migration after co-transfection