Figures & data
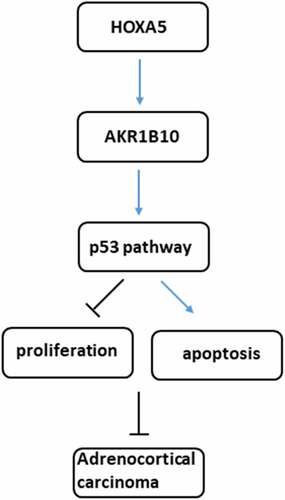
Figure 1. The relationship between AKR1B10 expression and ACC survival. A, the expression of AKR1B10 in ACC patients from GEPIA database. The red box represents the ACC group and the gray box represents the normal group. *P < 0.05. B and C, the relationship between AKR1B10 expression and percent survival of OS and DSF of ACC patients from GEPIA database
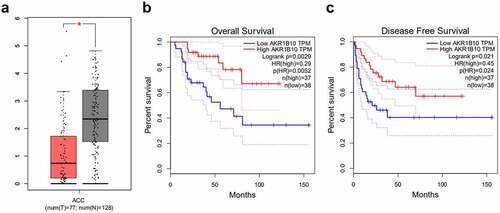
Figure 2. AKR1B10 overexpression inhibits NCI-H295 cells proliferation. A and B, the mRNA (a) and protein (b) expressions of AKR1B10 in Y1, SW-13 and NCI-H295 cell lines. C and D, the mRNA (A) and protein (B) expressions of AKR1B10 in NCI-H295 cells before and after AKR1B10 overexpression. E, the cell viability of NCI-H295 cells that overexpressed with AKR1B10 or not at 24, 48 and 72 h. F, the representative images for colony formation assay of NCI-H295 cells that overexpressed with AKR1B10 or not (×100). G, the protein expression of Ki67 and PCNA in NCI-H295 cells that overexpressed with AKR1B10 or not. **P < 0.01 and ***P < 0.001
Figure 3. AKR1B10 overexpression promotes NCI-H295 cells apoptosis and p53 signaling activation. A, representative images and quantitative analysis for Tunel staining (×200) of NCI-H295 cells that overexpressed with AKR1B10 or not. B, the protein expression of Bcl-2, Bax, c-caspase3 and c-caspase9 in NCI-H295 cells that overexpressed with AKR1B10 or not. C, the protein expression of p53 and p21 in NCI-H295 cells that overexpressed with AKR1B10 or not. **P < 0.01 and ***P < 0.001
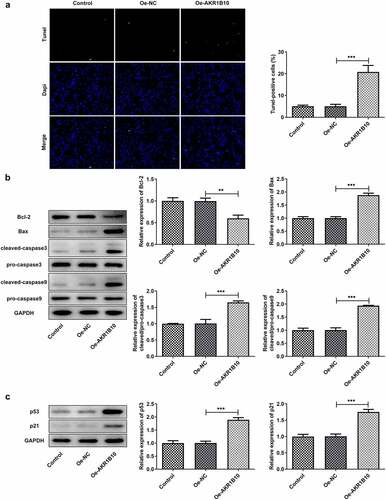
Figure 4. HOXA5 is down-regulated in ACC cell lines. A, the expression of HOXA5 in ACC patients from GEPIA database. The red box represents the ACC group and the gray box represents the normal group. *P < 0.05. B, the relationship between HOXA5 expression and percent survival of OS of ACC patients from GEPIA database. C, the relationship between the expression level of AKR1B10 and HOXA5 in ACC samples, data are from ENCORI. D and E, the mRNA (d) and protein (e) expressions of HOXA5 in Y1, SW-13 and NCI-H295 cell lines. *P < 0.05, **P < 0.01 and ***P < 0.001
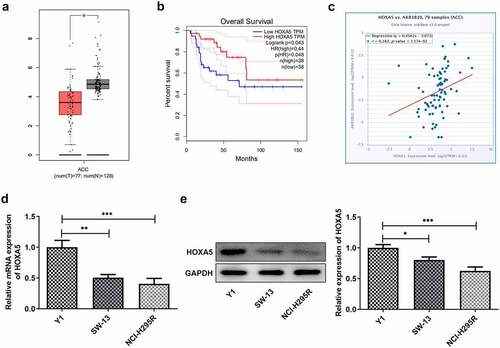
Figure 5. HOXA5 can bind to AKR1B10 and regulate its expression. A, the binding sequence between HOXA5 and AKR1B10 promoter predicted by JASPAR website. B and C, the mRNA (b) and protein (c) expressions of HOXA5 in NCI-H295 cells before and after HOXA5 overexpression. D and E, the mRNA (d) and protein (e) expressions of AKR1B10 in NCI-H295 cells before and after HOXA5 overexpression. F and G, the interaction between HOXA5 and AKR1B10 was assessed by dual-luciferase report (f) and ChIP (g) assays. **P < 0.01 and ***P < 0.001
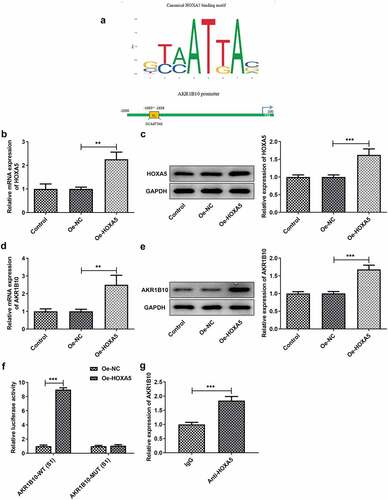
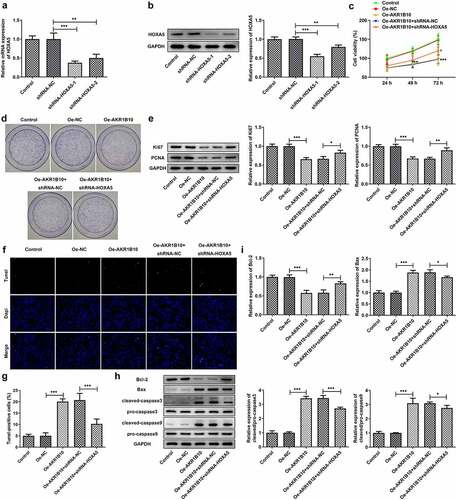
Figure 6. HOXA5 silence blocks the effects of AKR1B10 overexpression on NCI-H295 cells proliferation and apoptosis. A and B, the mRNA (a) and protein (b) expressions of HOXA5 in NCI-H295 cells before and after HOXA5 knockdown. C, the cell viability of NCI-H295 cells at 24, 48 and 72 h post-culture. D, the representative images for colony formation assay of NCI-H295 cells in different groups (×100). E, the protein expression of Ki67 and PCNA in NCI-H295 cells in different groups. F and G, representative images and quantitative analysis for Tunel staining (×200) of NCI-H295 cells. H and I, the protein expression of Bcl-2, Bax, c-caspase3 and c-caspase9 in NCI-H295 cells. *P < 0.05