
Figures & data
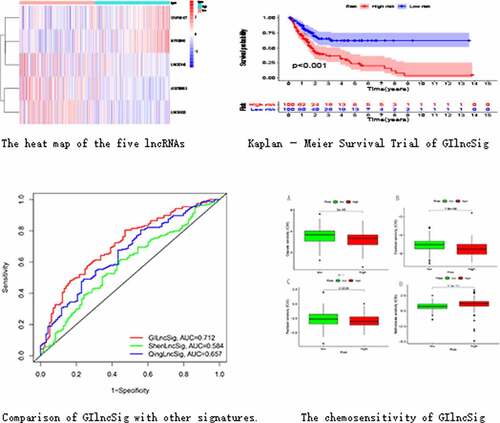
Table 1. Clinical and pathological characteristics of bladder cancer samples in this study
Figure 1. Heatmap of expression of 58 differential lncRNAs. The abscissa is the bladder cancer sample, which is divided into GS-like group (blue) and GU-like group (red), and the ordinate is 58 lncRNAs
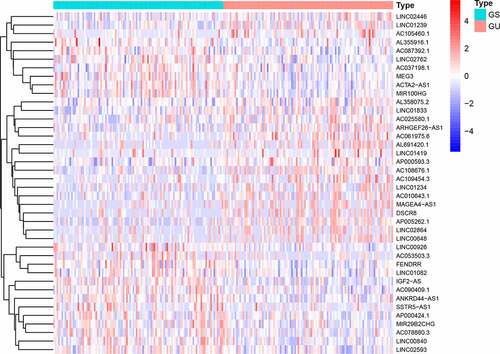
Figure 2. Co-expression network and enrichment analysis of differential lncRNAs. (a) Expression networks of differential lncRNAs and their associated mRNAs. The blue circles represent lncRNAs and red circles represent mRNAs. (b) Gene Ontology (GO) enrichment analysis and (c) Kyoto Encyclopedia of Gene and Genomes (KEGG) pathway analysis of mRNAs associated with differential lncRNAs
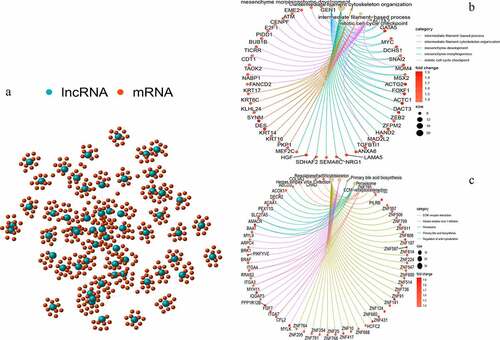
Table 2. LncRNAs associated with the prognosis of bladder cancer patients obtained after multivariate COX analysis
Figure 3. Identification of genomic instability-related lncRNA signature (GIlncSig). (a) Prognostic relevant lncRNAs obtained after univariate COX analysis. (b) Expression heatmap of five lncRNAs obtained after multivariate COX analysis. The abscissa is the bladder cancer sample, with blue representing the high-risk group and red representing the low-risk group
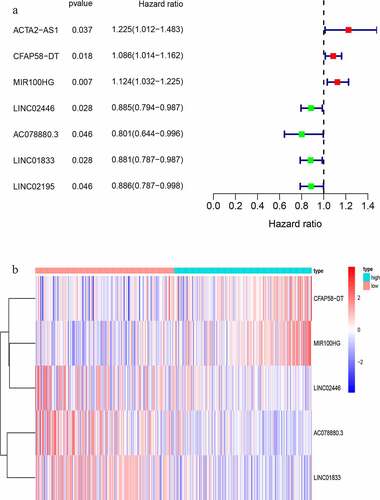
Figure 4. Evaluation of instability-related lncRNA genomic signature (GIlncSig) in the training group. (a) Kaplan – Meier Survival Trial of GIlncSig for High and Low Risk Groups. (b) Risk score for each tumor sample. (c) Survival outcome for each tumor sample. (d) Time-dependent ROC curve at 5 years
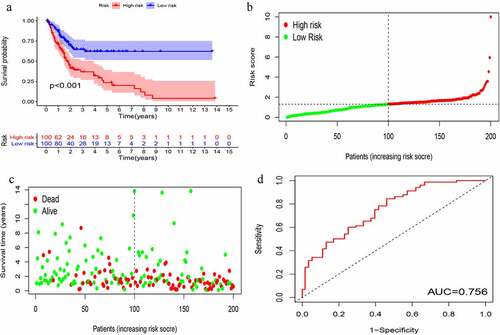
Figure 5. Evaluation of instability-related lncRNA genomic signature (GIlncSig) in the testing group. (a) Kaplan – Meier Survival Trial of GIlncSig for High and Low Risk Groups. (b) Risk score and (c) Survival outcome for each tumor sample. (d) Time-dependent ROC curve at 5 years
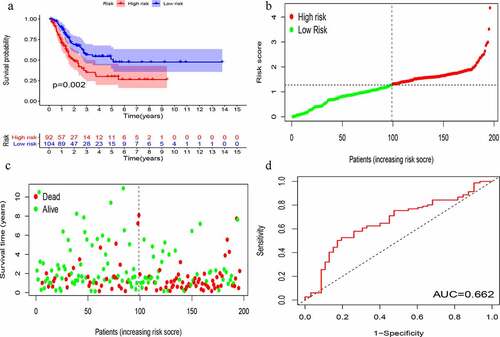
Figure 6. Clinical assessment of GIlncSig in the (a) training and (b) testing groups
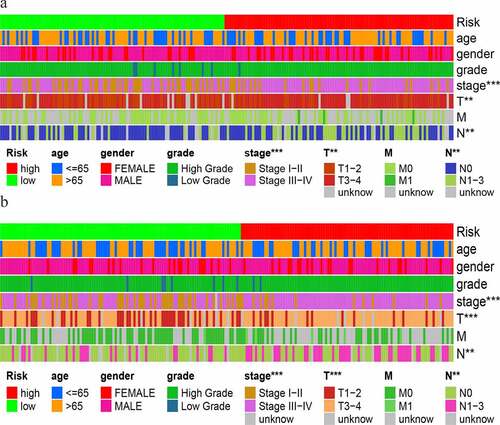
Table 3. Independence of GIlncSig by univariate and multivariate COX analysis
Figure 7. Stratified analysis of GIlncSig. Survival curves for high and low risk groups in patients ≤ 65 years (a) and > 65 years (b). Survival curves for high and low risk groups in early stage (c) and advanced stage patients (d)
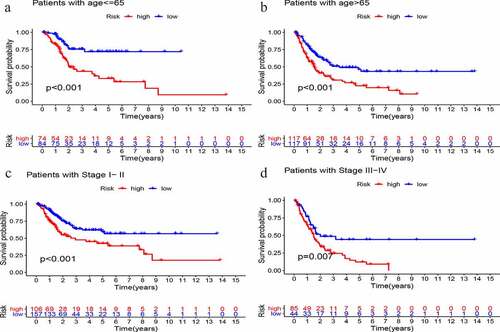
Figure 8. Comparison of Time-dependent ROC curves for GIlncSig, ShenlncSig and QinglncSig
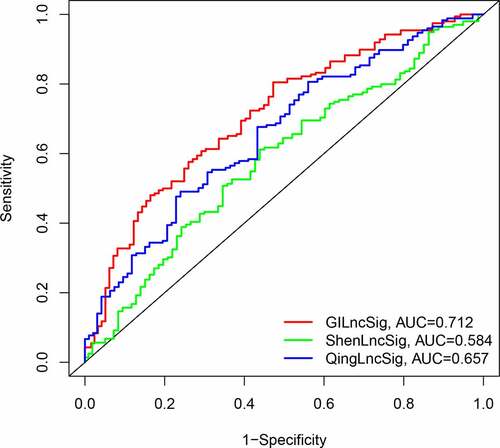
Figure 9. Validation of the prognostic performance of GIlncSig on Gene Expression Omnibus (GEO) datasets. (a) MIR100HG expression in different T stages of bladder cancer. (b) Kaplan – Meier survival curves between expression of MIR100HG and overall patient survival
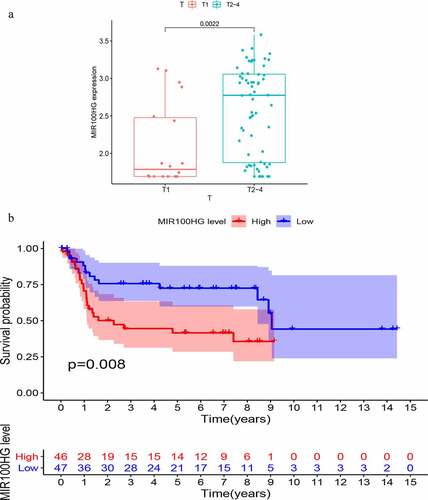
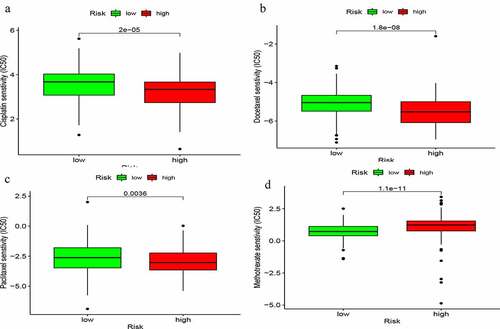
Figure 10. Chemosensitivity of GIlncSig. Correlation between GIlncSig and ic50 of cisplatin (a), docetaxel (b), paclitaxel (c) and methotrexate (d)
Supplemental Material
Download ()Dat availability statement
All the data sets of this study are available in the TCGA database(https://portal.gdc.cancer.gov/) and GEO database (http://www.ncbi.nlm.nih.gov/geo/).