
Figures & data
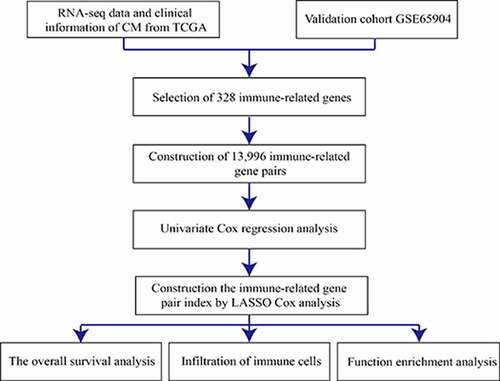
Table 1. Prognostic signature information about 41 constructed IRGPs
Figure 1. Time-dependent ROC curve for IRGPI at 5 years in the TCGA-CM cohort
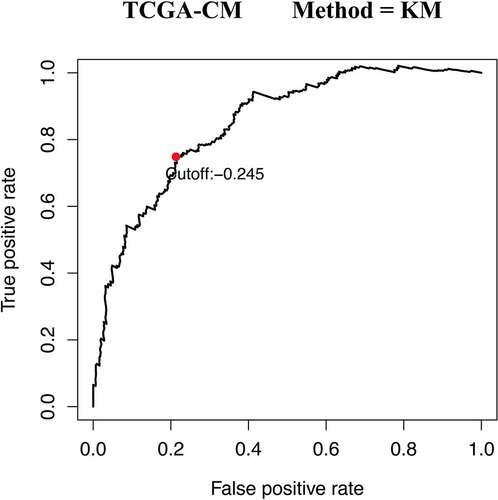
Figure 2. Efficacy evaluation of constructed IRGPI risk model. (a) Kaplan-Meier survival curve of TCGA cohort. (b) Kaplan-Meier survival curve of GSE65904 cohort. Univariate and multivariate Cox regression analysis of the clinicopathological features in TCGA (c) and GSE65904 (d) cohorts
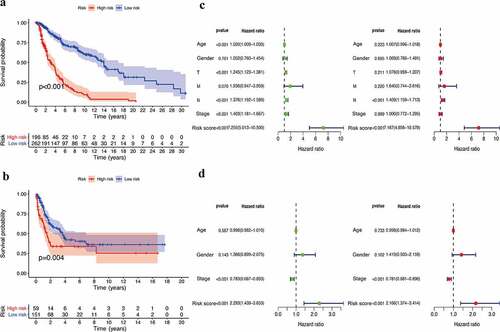
Figure 3. The infiltration level of immune cells in the constructed IRGPI risk model. (a) Summary of the 22 tumor-infiltrating immune cells’ abundance estimated by CIBERSORT analysis. p-values are based on t-test (*p< 0.05, ***p< 0.001). (b) The boxplot shows the distribution of specific immune cells in two risk subgroups from the TCGA cohort
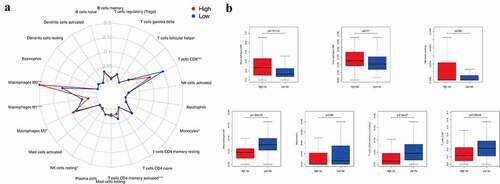
Figure 4. Gene set enrichment analysis (GSEA) between high- and low- IRGPI risk subgroups. The results show that 13 cancer hallmark gene sets are enriched in the low IRGPI risk subgroup (FDR < 0.002)
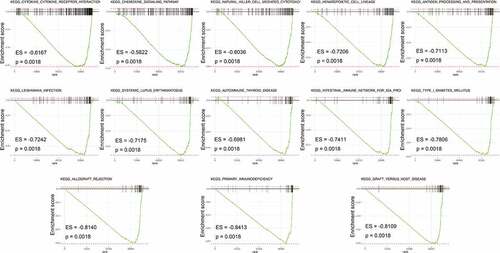
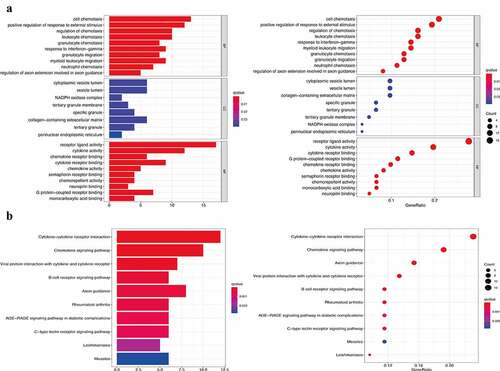
Figure 5. Functional enrichment analysis of 82 immune signature genes. (a) Top 10 classes of GO enrichment terms in biological process (BP), cellular component (CC), and molecular function (MF). (b) Top 10 classes of KEGG enrichment terms. In each bubble plot, the size of the dot represents the number of enriched genes