Figures & data
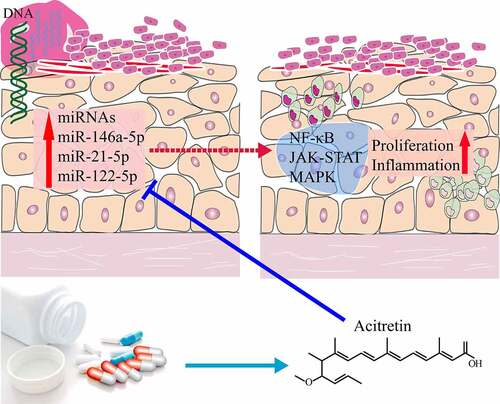
Table 1. Clinical information from subjects chosen for miRNA sequencing
Figure 1. The basic characteristics of plasma-derived miRNAs from patients with psoriasis vulgaris (Pso) and patients treated with acitretin (Pso-A). a. The distribution of miRNAs, obtained by sequencing, on chromosomes. b. The distribution of miRNA expression. C. UpSet plot showed the common and unique miRNAs in the Con group, the Pso group, and the Pso-A group. Horizontal bars represent the total number of identified miRNAs within each group. Vertical bars represent the number of the common miRNAs in each group. The black original point below indicates the common situation of each group. (The vertical bars show the number of intersecting miRNAs between tissues, as denoted by the connected black circles underneath the histogram. The horizontal bars show the miRNA set size. D. The distribution of miRNA lengths
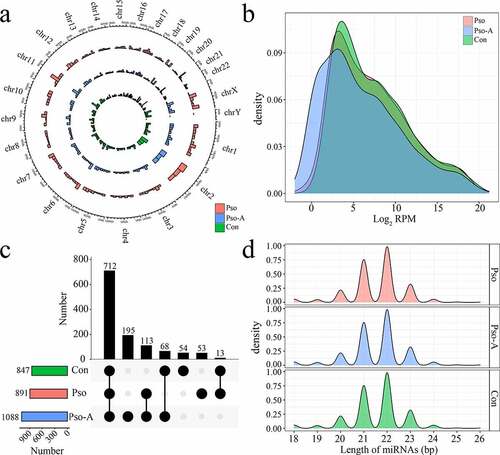
Figure 2. Differentially expressed miRNAs. a. The statistics of the number of differentially expressed miRNAs. b. Venn diagram demonstrates unique and common differential miRNAs between different groups. c. The clustering heat map of differential miRNA expression
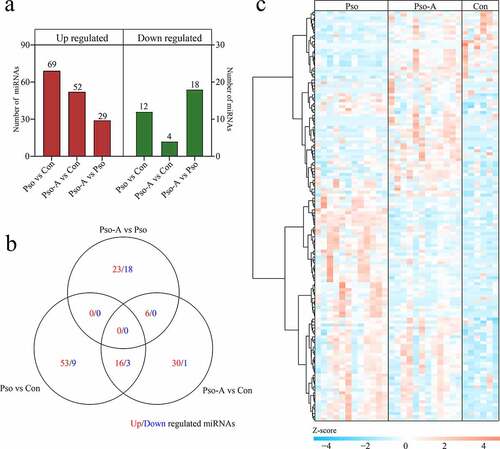
Figure 3. Plasma miRNAs are related to the efficacy of acitretin with regards to the treatment of psoriasis vulgaris. a. (Top) Venn diagram demonstrates the miRNAs that are up-regulated in the Pso group and down-regulated after acitretin treatment compared to the healthy group (Con). (Bottom) The miRNAs that are down-regulated in the Pso group and up-regulated after acitretin treatment compared with the healthy group. b. The 20 plasma-derived miRNAs that are related to psoriasis vulgaris after acitretin treatment in (a). The expression of miRNA is significantly different (Pso vs Con, Pso-A vs Pso; P< 0.05; |Log2 (fold change)| >1)
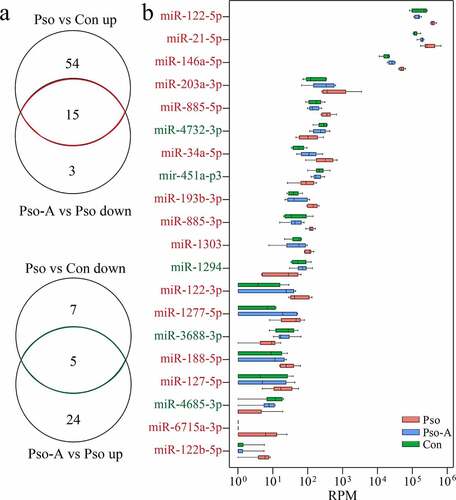
Table 2. The areas under the curve (AUC), 95% confidence intervals (95% CI), sensitivity, and specificity of the receiver operating characteristic (ROC) curve analyses
Figure 4. Validation analysis of the candidate miRNAs. a. The plasma-derived miRNAs from the Con (n = 80), Pso (n = 75), and Pso-A (n = 62) groups were analyzed using quantitative PCR. The significant difference between the two groups is evaluated through one-way ANOVA. The same letter represents insignificant difference, while different letters represent significant difference (p < 0.05). b. ROC analyzes the sensitivity and specificity of candidate miRNAs as diagnostic markers of psoriasis vulgaris. c. ROC analyzes the sensitivity and specificity of candidate miRNAs in order to evaluate the therapeutic effect of Acitretin
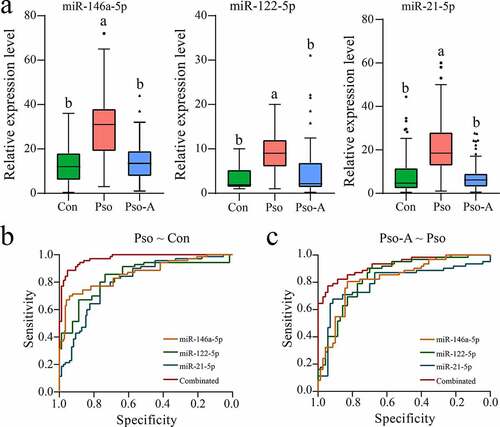
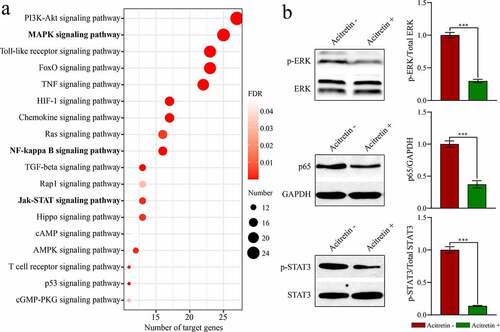
Figure 5. Acitretin has a therapeutic role by down-regulating the expression of miRNAs and inhibiting miRNA-mediated signaling pathways. a. KEGG analysis results of the target genes of the candidate miRNA. b. Western blot results validate the expression of p-STAT, p-ERK and p65 in HaCaT cells treated with acitretin in vitro.