Figures & data
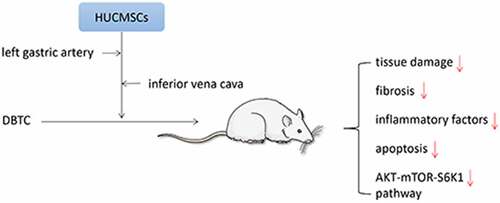
Figure 1. Experiment schedule. The rats were fed for 1 week to adapt to the environment. CP was induced by tail vein injection of DBTC. Except for the control group, others were given 10% ethanol per day for 10 weeks to induce pancreatic fibrosis. HUCMSCs were injected into the inferior vena cava and left gastric artery respectively in rats on the third week. DBTC, Dibutyltin chloride; HUCMSCs, human umbilical cord mesenchymal stem cells
Figure 2. In DBTC-induced pancreatic fibrosis, HUCMSCs reduced pancreatic tissue damage. Morphology of pancreas. Sirius red staining sections were examined under an optical microscope (original magnification, 200×)
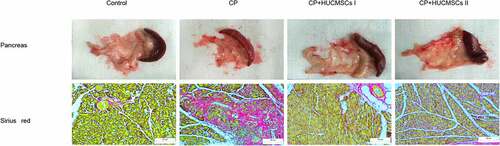
Figure 3. HUCMSCs inhibited the expression of inflammatory factors in the pancreas. Detection of the expression of IL-6 and IL-1β by (a) immunohistochemistry assays (original magnification, 200×) and (b-c) Western blot assay for the expression of IL-6, IL-1β and TNF-α. #P < 0.05 versus the control group; *P < 0.05 versus the DBTC-induced CP model group
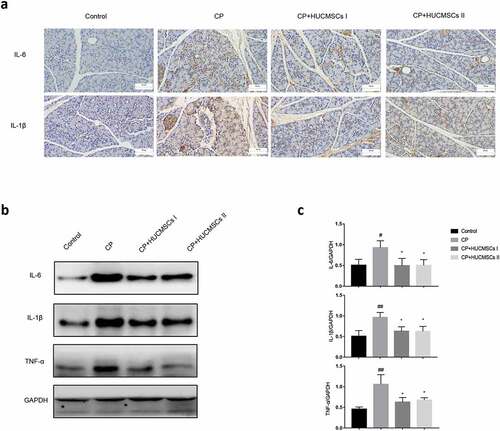
Figure 4. HUCMSC treatment reduced fibrosis in CP. (a–b) Expression of COI, COIII, and α-SMA was detected by Western blot analysis. (c–e) Contents of HA, VA, and FN in serum were measured by ELISA. #P < 0.05 versus the control group; *P < 0.05 versus the DBTC‑induced chronic pancreatitis model group; HA, Hyaluronic acid; VA, vitamin A; FN, Fibronectin; COI, collagen type I; COIII, collagen type III
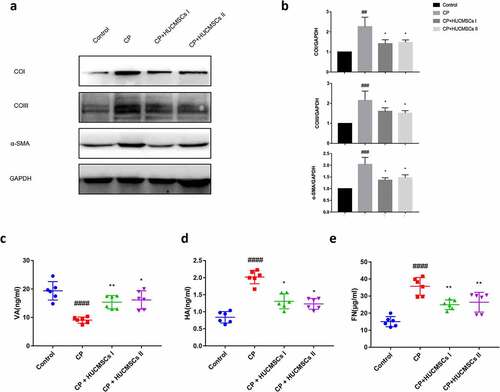
Figure 5. HUCMSCs decrease the apoptosis of pancreatic cells in DBTC-induced CP. (a–b) Western blot analysis was used to detect the expression of Bax, caspase-3, and p-53. #P < 0.05 versus the control group; *P < 0.05 versus the DBTC-induced chronic pancreatitis model group
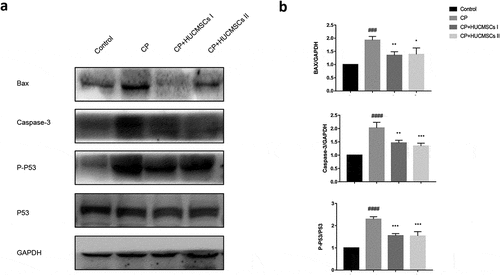
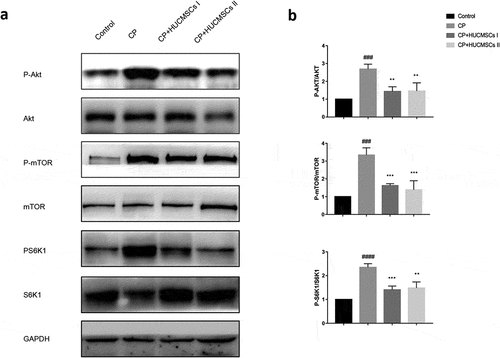
Figure 6. HUCMSCs improve DBTC induced CP by inhibiting AKT-mTOR-S6K1 pathway. Western blot analysis was used to detect the protein expression levels of (a-b) p-AKT, AKT, p-mTOR, mTOR, p-S6k1, and S6K1 . #P < 0.05 versus the control group; *P < 0.05 versus the DBTC-induced chronic pancreatitis modelgroup