Figures & data
Table 1. Primers and siRNAs used in this study
Figure 1. LncRNA TINCR correlated with TCPTP protein. (a) Schematic diagram of RNA pull-down assay/mass spectrometry procedures. (b) RNA pull-down assay was conducted by using antisense synthesized TINCR RNA (Antisense) or full-length sense synthesized TINCR RNA (TINCR). The purified interacting proteins from Hep3B was detected by using SDS-PAGE and silver staining. Red box indicates position of gel slice for mass spectrometry. (c) Annotated MS/MS spectrum assigned to the TCPTP peptide CAQYWPTDDQEMLFK from TINCR vs. TINCR antisense RNA pull-down assay. (d) Western blot experiment demonstrated the interaction between TCPTP and TINCR. The purified interacting proteins from Hep3B was obtained from TINCR vs. TINCR antisense RNA pull-down assay. AS, TINCR antisense RNA. (e) The interaction fragments between LncRNA TINCR (NR_027064.3) and protein TCPTP (isoform 2, NP_536347) were predicted by using catRAPID omics algorithm. (f) Visualization of interaction between TCPTP and TINCR was simulated by Protein Data Bank and mfold web server. The active site (cysteine 216) of TCPTP is shown in red. (g) Schematic diagram for generating in vitro transcription of biotinylated TINCR fragment constructions (Antisense 1–3733 nt, FL 1–3733 nt, D1 360–3733 nt, D2 1100–3733 nt, D3 1800–3733 nt, D4 1–1800 nt). The Hep3B cellular protein was extracted for RNA pull down assay. The different TINCR in vitro transcriptions were employed to perform RNA pull-down assay, and western blotting was performed to detect TCPTP protein in purified proteins and Input. (h) Western blot for TCPTP and real-time PCR for TINCR using RNA immunoprecipitation (RIP) enriched samples of Hep3B and HCCLM3 cells. Data are given as mean ± SEM (n = 3, *P < 0.05, by Student’s t-test)
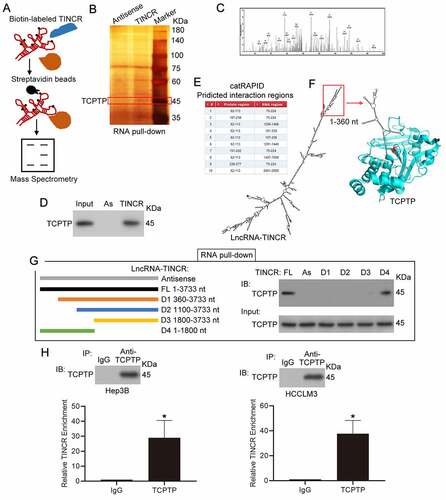
Figure 2. LncRNA TINCR promotes hepatocellular carcinoma (HCC) cell growth and inhibits apoptosis through TCPTP. (a) Real-time PCR assay of TINCR expression in different TINCR siRNA-silenced Hep3B and HCCLM3 cells. Data are indicated as mean ± SEM (n = 3, *P < 0.05, by ANOVA). (b) Western blot assay of TCPTP in TCPTP siRNA-silenced Hep3B and HCCLM3 cells. Data are indicated as mean ± SEM (n = 3, *P < 0.05, by Student’s t-test). (c) Real-time PCR assay of TCPTP in TCPTP siRNA-silenced Hep3B and HCCLM3 cells. Data are shown as mean ± SEM (n = 3, *P < 0.05, by Student’s t-test). The CCK-8 (d), colony formation (e and f), EdU (g and h), and apoptosis (i and j) assays were performed in Hep3B and HCCLM3 cells transfected with siRNA-NC, siRNA-TINCR, or co-transfected with siRNA-TINCR and siRNA-TCPTP. Data are given as mean ± SEM (n = 3, *P < 0.05, by ANOVA)
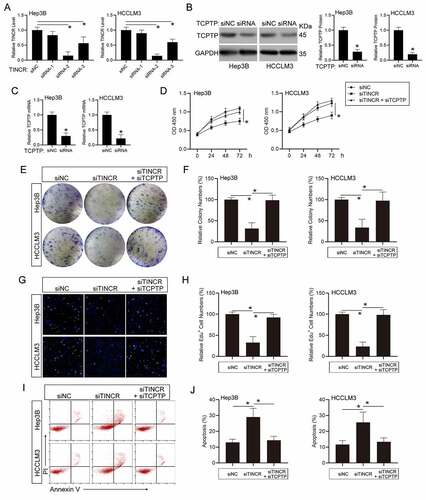
Figure 3. LncRNA TINCR promotes HCC cell invasion and STAT3 signaling through TCPTP. The wound healing (a and b) and transwell (c and d) assays were conducted in Hep3B and HCCLM3 cells transfected with siRNA-NC, siRNA-TINCR, or co-transfected with siRNA-TINCR and siRNA-TCPTP. Data are given as mean ± SEM (n = 3, *P < 0.05, by ANOVA). (e and f) Real-time PCR assay of STAT3 target genes expression in Hep3B and HCCLM3 cells transfected with siRNA-NC, siRNA-TINCR, or co-transfected with siRNA-TINCR and siRNA-TCPTP. Data are indicated as mean ± SEM (n = 3, *P < 0.05, by ANOVA). (G, H and I) Western blot assay of STAT3 phosphorylation and STAT3 target genes in HCCLM3 cells transfected with siRNA-NC, siRNA-TINCR, or co-transfected with siRNA-TINCR and siRNA-TCPTP. Data are given as mean ± SEM (n = 3, *P < 0.05, by ANOVA)
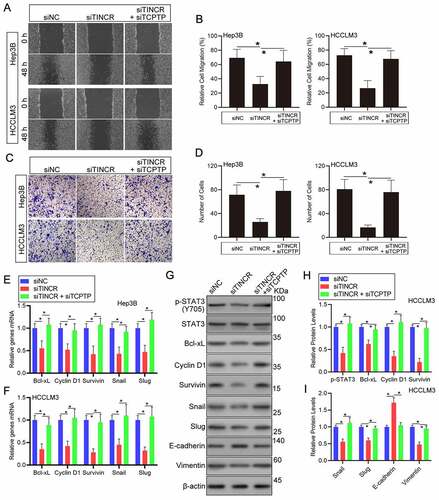
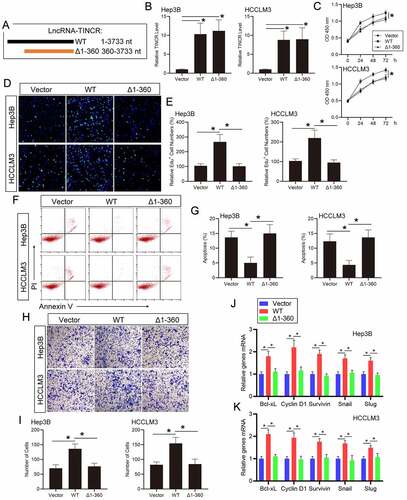
Figure 4. LncRNA TINCR regulates HCC progression and STAT3 signaling via direct interacting with TCPTP. (a) Schematic illustration of the plasmids encoding full-length (WT, 1–3733 nt) or the fragments (Δ1-360, 360–3733 nt) of TINCR. (b) Real-time PCR assay of TINCR expression in Hep3B and HCCLM3 cells transfected with WT or Δ1-360 TINCR. Data are given as mean ± SEM (n = 3, *P < 0.05, by ANOVA). The CCK-8 (c), EdU (d and e), apoptosis (f and g), and transwell (h and i) assays were conducted in Hep3B and HCCLM3 cells transfected with WT or Δ1-360 TINCR. Data are indicated as mean ± SEM (n = 3, *P < 0.05, by ANOVA). (j and k) Real-time PCR assay of STAT3 target genes expression in Hep3B and HCCLM3 cells transfected with WT or Δ1-360 TINCR. Data are given as mean ± SEM (n = 3, *P < 0.05, by ANOVA)