Figures & data
Figure 1. Composition analysis of immune cells of peripheral blood and parotid samples from pSS patients and controls. (a) The visualization of levels of immune cells in the peripheral blood from pSS patients and controls. (b) The violin plot showed an elevated level of naïve B cells and a decreased level of memory B cells in the peripheral blood of pSS patients (P < 0.05). (c) The visualization of levels of immune cells in the parotid tissues from pSS patients and controls. (d) The violin plot showed elevated levels of naïve B cells and memory B cells in the parotid tissues of pSS patients (P < 0.05)
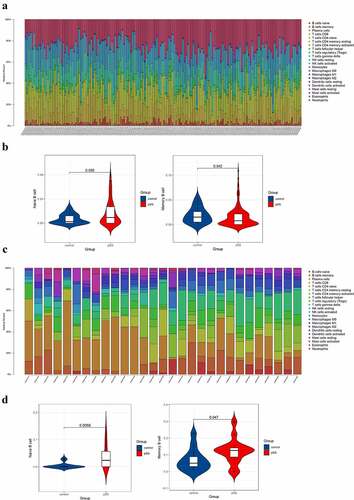
Figure 2. Construction of co-expression modules in the whole peripheral blood from pSS patients and controls. (a) Screening for power values. When 7 is chosen as the soft threshold, the scale independence is greater than 0.8 and the mean connectivity is lesser than 100. (b) Clustering dendrogram of co-expression modules. (c) The network heatmap plot of the modules
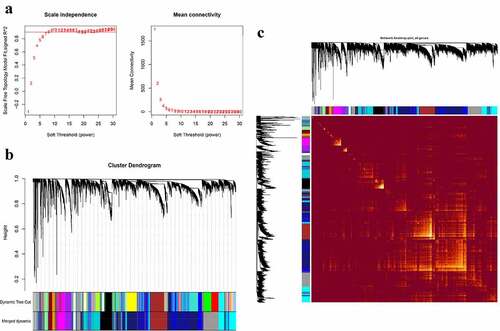
Figure 3. Construction of co-expression modules in the parotid tissues from pSS patients and controls. (a) Screening for power values. When 9 is chosen as the soft threshold, the scale independence is greater than 0.8 and the mean connectivity is lesser than 100. (b) Clustering dendrogram of co-expression modules. (c) The network heatmap plot of the modules
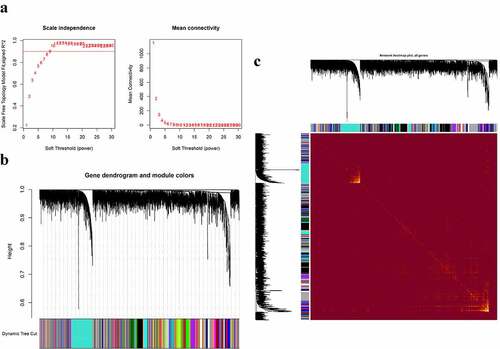
Figure 4. Co-expression modules mostly related to B cells in the whole peripheral blood in pSS. (a) Heatmap plot of the correlation between modules and B cells in the whole peripheral blood. (b) The gene significance for naïve B cells in the lightgreen module (One dot in the picture represents one gene in the lightgreen module.). (c) The gene significance for memory B cells in the blue module. (d) Functional enrichment in the lightgreen module. (e) Functional enrichment in the blue module
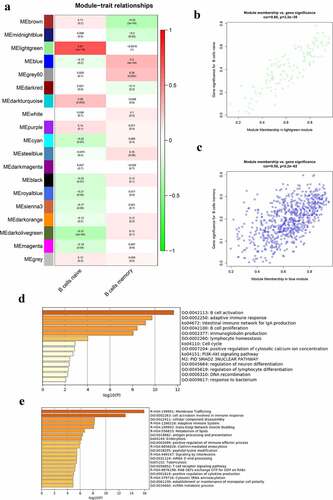
Figure 5. Co-expression modules mostly related to B cells in the parotid tissues in pSS. (a) Heatmap plot of the correlation between modules and B cells in the parotid tissue. (b) The gene significance for naïve B cells in the turquoise module. (c) The gene significance for memory B cells in the lightgreen (left) and black (right) modules. (d) Functional enrichment in the turquoise module. (e) Functional enrichment in the lightgreen module. (f) Functional enrichment in the black module
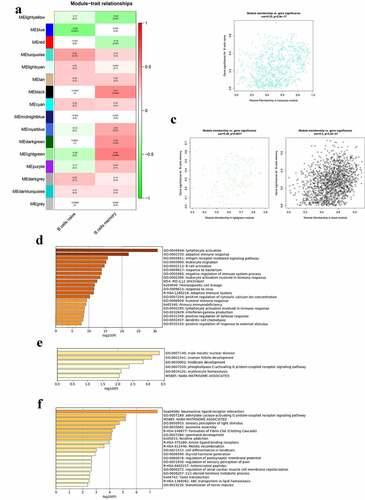
Figure 6. Identification of differentially expressed genes (DEGs). (a) DEGs in GSE66795. (b) DEGs in GSE40611. (c) The numbers of intersecting genes between DEGs in GSE66795 and genes in the lightgreen module (left) and blue module (right). (d) The numbers of intersecting genes between DEGs in GSE40611 and turquoise, lightgreen and black module
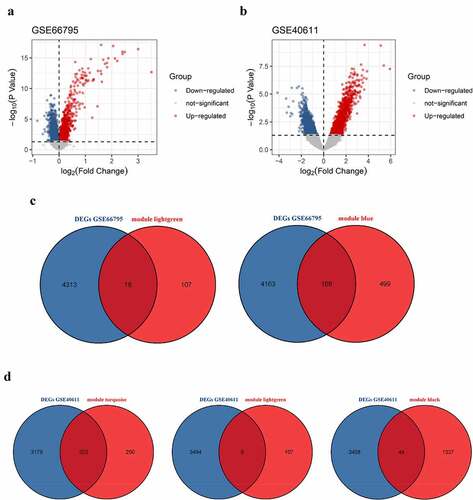
Figure 7. Visualization of hub genes involved in the levels of B cells in the whole peripheral blood of pSS patients. (a) The top 7 hub genes involved in the increased level of circulating naïve B cells. (b) The top 10 hub genes involved in the decreased level of circulating memory B cells
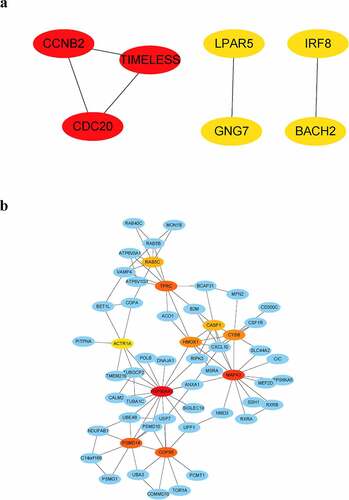
Figure 8. Visualization of hub genes associated with the levels of B cells in the parotid tissue of pSS patients. (a) The top 10 hub genes associated with the increased level of naïve B cells in parotid tissue. (b) The top 9 hub genes related to the elevated level of memory B cells in parotid tissue
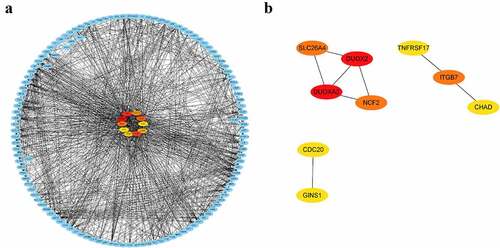
Figure 9. Hub genes showing significantly differential expression in GSE51092 dataset
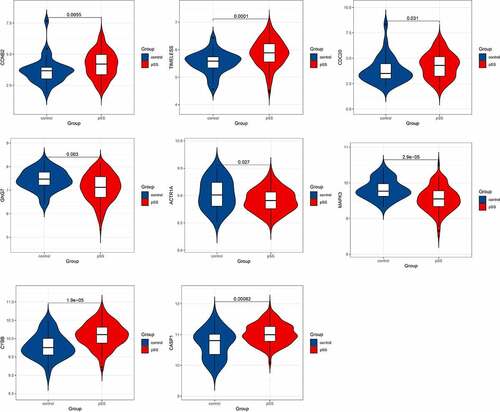
Figure 10. KEGG pathways significantly enriched in peripheral blood of pSS patients via GSEA (nominal P < 0.05)
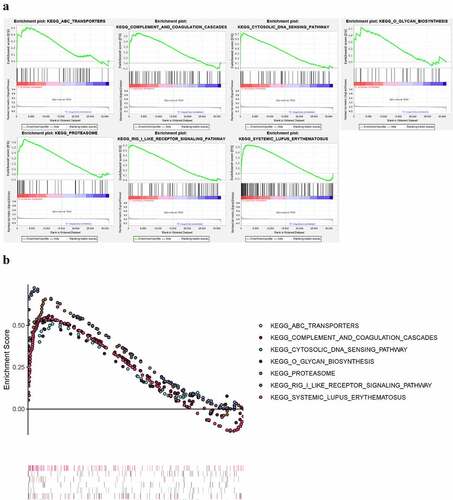
Figure 11. The GSEA analysis of lymphocyte activation, adaptive immune response and antigen receptor pathway in GSE66795, GSE51092 and GSE40611. (a) The adaptive immune response pathway was found to be significantly enriched in the peripheral blood of pSS patients in the GSE66795 dataset. (b) The adaptive immune response and the positive regulation of lymphocyte activation pathways were significantly enriched in the peripheral blood of pSS patients in GSE51092. (c) All of these three pathways were significantly enriched in the parotid tissue of pSS patients in GSE40611
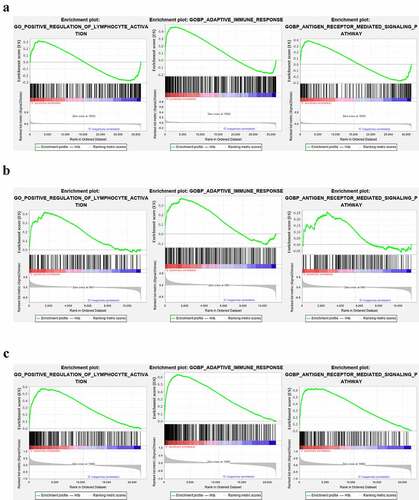
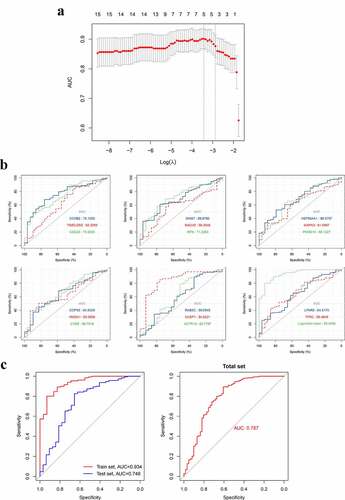
Table 1. The genes in the diagnostic model identified by Logistic regression analysis
Figure 12. The construction and assessment of the gene-based diagnostic model. A. The screening process of the models (via LASSO regression analysis). B. ROC curve and AUC value of hub genes in the training set. C. The ROC curve and AUC value of the diagnostic model in train set GSE66795, the test set GSE51092 and the total set. LASSO, Least absolute shrinkage and selection operator