Figures & data
Figure 1. Insulin sensitizes choriocarcinoma cells to 5-FU in vitro. (a) CCK-8 assays were used to evaluate cell proliferation at different times. (b) Colony formation assay showing proliferation of JEG-3 and JARS cells cultured in 5-FU or insulin for 48 h. (c) Quantification and analysis of apoptosis rates of JEG-3 and JARS cells cultured in 5-FU or insulin for 48 h using flow cytometry. (d) Western blot analysis showing protein expression levels of p-gp, MRP1, cleaved caspase-3 (Cle-Casp3), pro caspase-3 (Pro-Casp3), and BCL-2 in JEG-3 and JARS cells. β-Actin was used as the internal reference. (e) Cells migration rate detection using Transwell assay. Data are expressed as mean ± SEM (n = 3; *p < 0.05)
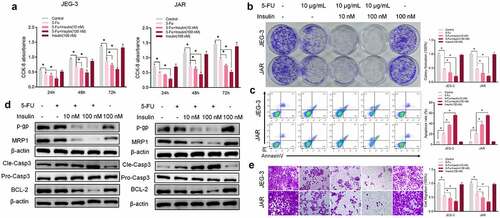
Figure 2. Insulin sensitizes choriocarcinoma cells to 5-FU in vivo. (a) Representative images of xenograft tumors isolated from nude mice in the different groups. (b) Tumor sizes in different groups. (c) TUNEL assay of xenograft tumors tissue. (d) Immunohistochemistry of Ki-67 in xenograft tumors tissue. (e) Western blot analysis showing protein expression levels of p-gp, MRP1, cleaved caspase-3, pro caspase-3, and BCL-2 in xenograft tumor tissue. β-Actin was used as the internal reference. Data are expressed as mean ± SEM (n = 5; *p < 0.05)
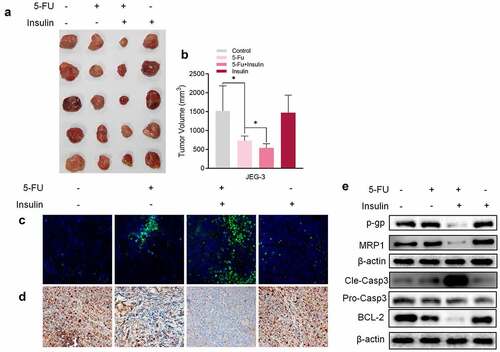
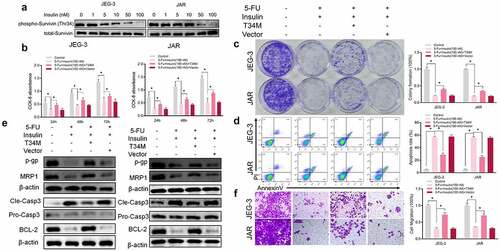
Figure 3. Insulin sensitizes choriocarcinoma cells to 5-FU by modulating phosphorylation of Survivin. (a) Western blot analysis showing protein expression of level of survivin and phosphorylation (Thr34) of survivin in JEG-3 and JARS cells. (b CCK-8 assays were performed to evaluate cell proliferation at different times. (c) Colony formation assay showing proliferation in JEG-3 and JARS cells after transfection with survivin Thr34 phosphomimetic mutant vector (T34M) and culturing in 5-FU or insulin for 48 h. (d) Quantification and analysis of apoptosis rates in JEG-3 and JARS cells after transfection with T34M and culturing in 5-FU or insulin for 48 h using flow cytometry. (e) Western blot analysis showing protein expression levels of p-gp, MRP1, cleaved caspase-3 (Cle-Casp3), pro caspase-3 (Pro-Casp3), and BCL-2 in JEG-3 and JARS cells. β-Actin was used as the internal reference. (f) Cells migration rates detection using Transwell assay. Data are expressed as mean ± SEM (n = 3; *p < 0.05)