Figures & data
Figure 1. CircRASSF2 is upregulated in BC tissue and correlates with the progression and poor prognosis (a) The expression levels of circRASSF2 in BC tissue and normal tissue were detected by qRT-PCR. (b) The expression levels of circRASSF2 in BC cell lines (T47D, MCFMFC, MCFMU7, BT549, Hsmur578, MDAMUMU231, MDAMurMBMUL468) and Normal breast epithelial MCF-10A cells were detected by qRT-PCR. (c) Kaplan-Meier survival curve was used to evaluate the overall survival time of BC patients with low expression of circRASSF2 (n = 35) and high expression of circRASSF2 (n = 35). (d) Kaplan-Meier survival curve was used to evaluate the progression-free survival time of BC patients with low expression of circRASSF2 (n = 35) and high expression of circRASSF2 (n = 35). *, P < 0.05; **, < 0.01; ***, P < 0.001
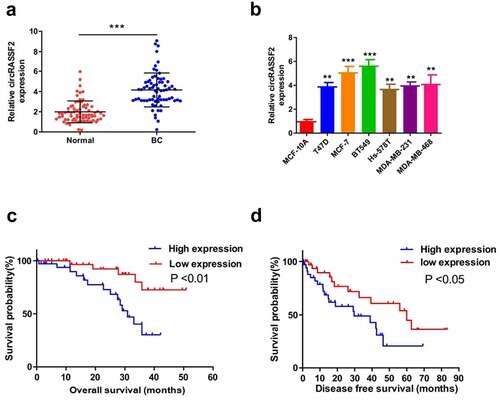
Table 1. Correlations of CircRASSF2 expression with clinicopathologic features of breast cancer patients
Figure 2. CircRASSF2 is highly expressed in serum of patients with BC and can be a good diagnosis marker. (a) The expression levels of circRASSF2 in BC serum were detected by qRT-PCR. (b) ROC analysis was used for calculating predictive values. *, P < 0.05; **, < 0.01; ***, P < 0.001
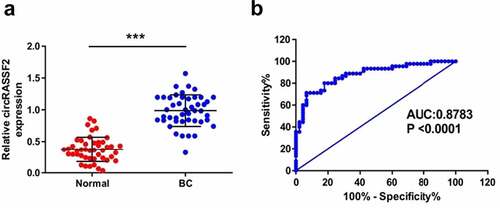
Figure 3. Knockdown of circRASSF2 inhibits BC cells proliferation and induced apoptosis. (a) The knocking efficiency was detected by qRT-PCR. (b) CCK-8 assay was used to detect the proliferative activity in different groups of MCF7 and BT549 (si-NC and si-circRASSF2) at different times (0 h, 24 h, 48 h and 72 h). (c) Clone formation assay was used to detect the clone formation ability of different groups of MCF7 and BT549 cells (si-NC and si-circRASSF2). (d) Flow cytometry was used to detect the level of apoptosis in different groups of MCF7 and BT549 (si-NC and si-circRASSF2). (e) Western blotting assay was used to detect the protein levels of PCNA, Cleaved-PARP and cleaved-caspase3 in different groups of MCF7 and BT549 (si-NC and si-circRASSF2). *, P < 0.05; **, < 0.01; ***, P < 0.001
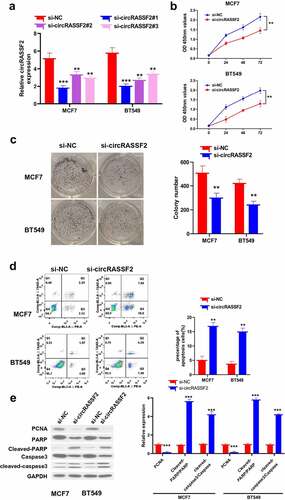
Figure 4. Knockdown of circRASSF2 inhibits migration and invasion of BC cells. (a) The migration ability of different groups of MCF7 and BT549 (si-NC and si-circRASSF2) was detected by Transwell (without matrix glue). (b) The invasive ability of different groups of MCF7 and BT549 (si-NC and si-circRASSF2) was detected by Transwell (with matrix glue). (c) Western blotting assay used to detect the protein levels of MMP2 and MMP9 in different groups of MCF7 and BT549 (si-NC and si-circRASSF2). *, P < 0.05; **, < 0.01; ***, P < 0.001
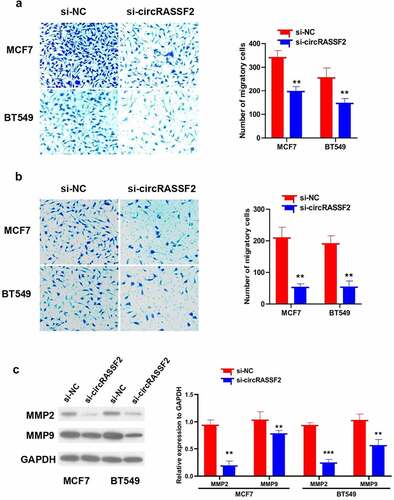
Figure 5. CircRASSF2 up-regulates HOXA1 protein levels in BC cells via sponge miR-1205. (a) Bioinformatics target prediction and dual luciferase reporter gene assay verified. (b) qRT-PCR method was used to detect the expression of miR-1205 in circRASSF2 knocking down MCF7 and BT549 cells. (c) Bioinformatics target prediction and dual luciferase reporter gene assay verified. (d) The HOXA1 protein expression levels in miR-1205 overexpression MCF7 and BT549 cells by Western blotting method. (e) The HOXA1 protein expression levels in MCF7 and BT549 (si-NC and si-circRASSF2, si-circRASSF2+ miR-1205 inhibitor). *, P < 0.05; **, < 0.01; ***, P < 0.001
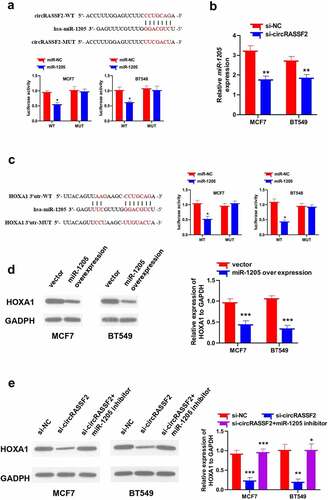
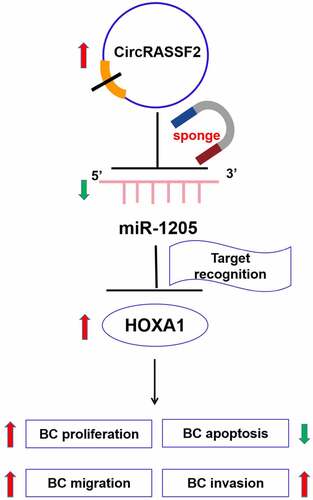
Figure 6. A schematic diagram showing the regulatory role of circRASSF2/miR-1205/HOXA1 axis in BC cells