
Figures & data
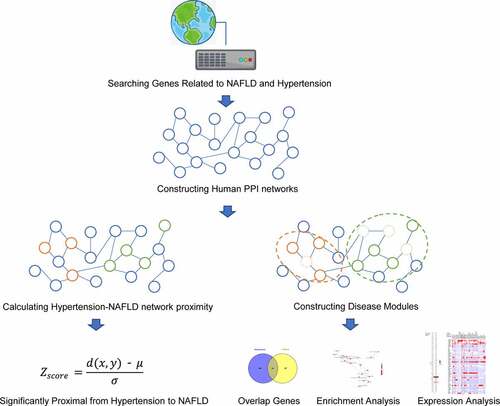
Figure 1. Common genes among Non‐alcoholic fatty liver disease (NAFLD), NAFLD-related phenotypes and hypertension. (a) Venn diagram showing the number of genes that are shared by NAFLD, NAFLD-related phenotypes and hypertension. (b) Word cloud diagram showing the genes in the NAFLD, NAFLD-related phenotypes and hypertension. The size of word depends on term frequency in the four gene list. C. Protein-protein interaction network of intersective genes among NAFLD, NAFLD-related phenotypes and hypertension
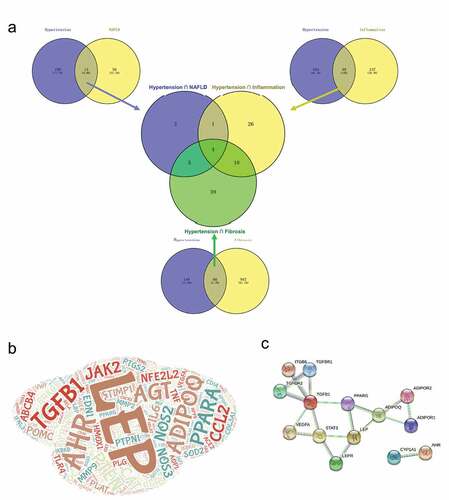
Figure 2. Gene Ontology (GO) terms of genes among Non‐alcoholic fatty liver disease (NAFLD), NAFLD-related phenotypes and hypertension. Heat map showing biological process (a), molecular function (b) and cellular component (c) that are shared by NAFLD, NAFLD-related phenotypes and hypertension
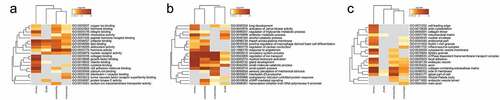
Figure 3. Gene Ontology (GO) terms of genes among Non‐alcoholic fatty liver disease (NAFLD) module and hypertension module. Bubble plots showing biological process (a), molecular function (b) and cellular component (c) that are shared by NAFLD module and hypertension module
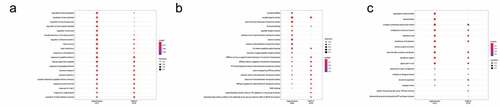
Figure 4. Gene Ontology (GO) and KEGG enrichment of 64 shared genes of Non‐alcoholic fatty liver disease (NAFLD) module and hypertension module. (a) Venn diagram showing the number of genes that are shared by NAFLD module and hypertension module. Bubble plots showing biological process (b), molecular function (c), cellular component (d) and KEGG pathway (e) terms of 64 shared genes of NAFLD module and hypertension module
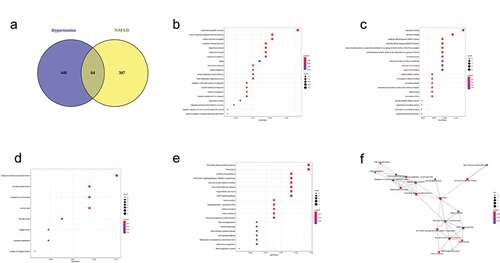
Figure 5. Non‐alcoholic fatty liver disease (NAFLD) and hypertension: gene-drug interaction network
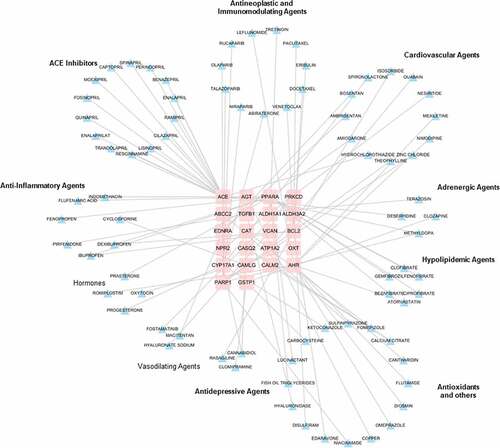
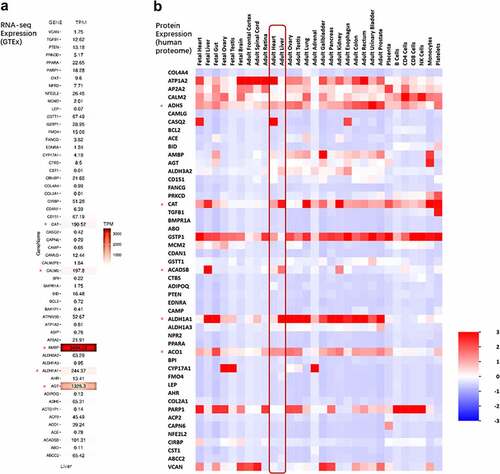
Figure 6. Expression pattern in different tissue of 64 shared genes. (a) MRNA expression heat map for the list of the 64 shared genes in liver. Expressive data was extracted from The GTEx Consortium. (b) Protein expression heat map for the list of the 64 shared genes in different tissues. Expressive data was extracted from UniProt database by FunRich tool
Supplemental Material
Download ()Data availability statement:
The data that support the findings of this study are available with the corresponding author upon reasonable request.