Figures & data

Table 1. Clinical information of participator with or without GDM
Figure 1. The impacts of HG treatment on proliferation, apoptosis, and miR-362-5p level in HTR-8/SVneo cells. (a) Cell apoptosis was detected by flow cytometry after treating with HG. (b) Quantification of A. (c) The proliferation of HG-treated cells was determined by CCK-8. (d) MiR-362-5p expression was tested by qPCR in HTR-8/SVneo cells treated with or without HG. (e) The level of miR-362-5p was tested in placenta tissues from healthy (n = 40) or GDM women (n = 40) through qPCR. **P < 0.01
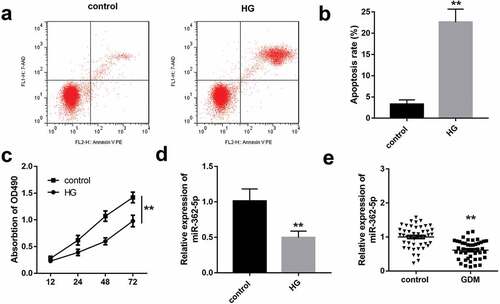
Figure 2. MiR-362-5p overexpression enhanced the proliferation and inhibited apoptosis. (a) Transfection efficiency was measured by qPCR post-transfection. (b) CCK-8 was used to evaluate cell proliferation and (c–d) flow cytometry was carried out to evaluate cell apoptosis in transfected cells. **P < 0.01
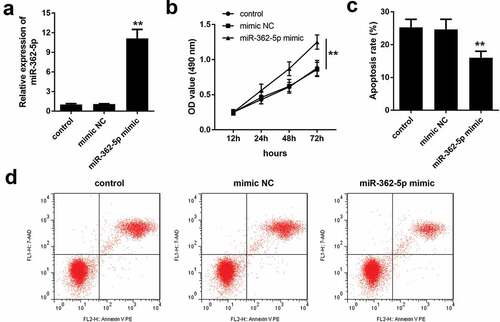
Figure 3. MiR-362-5p could target to GSR. (a) The binding sites of miR-362-5p on 3ʹUTR region of GSR was predicted. (b) Relative luciferase activity was measured when cells co-transfected with mimic plasmids together with wt GSR 3ʹUTR and mut 3ʹUTR of GSR. (c) GSR expression was detected by qPCR after transfection. (d) The enrichment of GSR was measured using Biotin-miRNA pull-down assay. **P < 0.01, ##P < 0.01
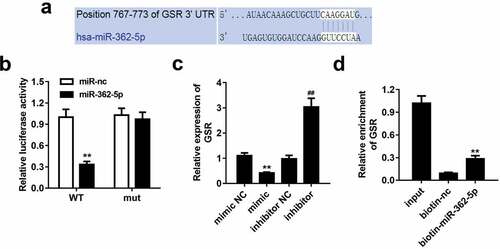
Figure 4. Upregulation of GSR expression was measured in placenta tissues of GDM. (a) GSR expression was tested in placenta tissues from 40 healthy and 40 GDM women by qPCR. (b) MiR-362-5p and GSR relationship in GDM placenta tissues was determined by Pearson correlation coefficient. **P < 0.01
Figure 5. Enforced level of GSR rescued miR-362-5p induced effects on cell proliferation and apoptosis. (a) Transfection efficiency was measured by qPCR after transfection. (b) Cell proliferation was analyzed using CCK-8 in cells transfection of miR-362-5p mimic and pcDNA3.1-GSR. (c–d) Flow cytometry was performed to assess cell apoptosis after miR-362-5p mimic and pcDNA3.1-GSR transfected into HG-treated HTR-8/SVneo cells. Apoptosis rate was analyzed. **P < 0.01
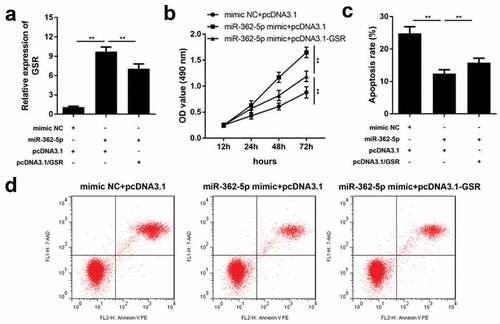
Figure 6. MiR-362-5p affected PI3K/AKT signaling and bax, cleaved caspase3, and bcl-2 expression via targeting GSR. (a) The protein expression of each signaling was determined by western blot. (b) Quantification of the relative protein expression normalized to GAPDH. **P < 0.01