
Figures & data
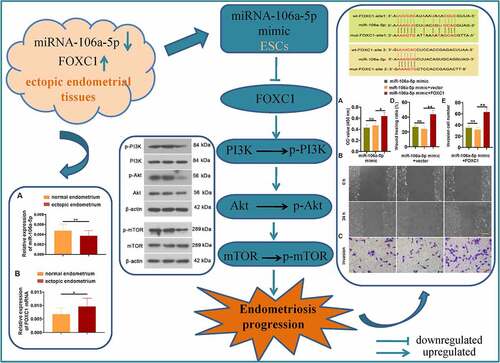
Figure 1. miR-106a-5p was decreased and FOXC1 was increased in endometrial tissues. (a) The RT-qPCR assay demonstrated a decreased level of miR-106a-5p in ectopic endometrial specimens compared with normal endometrial specimens. Student’s t-test, **p < 0.01. (b) FOXC1 mRNA level was increased in ectopic endometrial specimens compared with normal endometrial specimens. Student’s t-test, *p < 0.05. (c) An immunofluorescence assay was conducted to detect the expression of Vimentin and Cytokeratin in ectopic endometrial stromal cells (ESCs). DAPI was used to stain the nucleus (blue). Scale bar: 50 μm
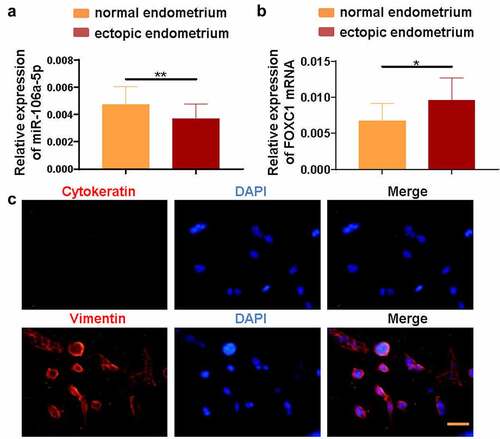
Figure 2. miR-106a-5p repressed ESC proliferation, invasion, and migration. (a) The expression of miR-106a-5p in ESCs with miR-106a-5p mimic transfected. One-way ANOVA. **p < 0.01, ns: not-significant. (b) The CCK-8 assay was performed to examine the cell viability of ESCs transfected with miR-106a-5p mimic. Two-way ANOVA. **p < 0.01, ns: not-significant. (c, d) A wound-healing assay and the transwell invasion assay were carried out to measure the cell migration and invasion of ESCs transfected with miR-106a-5p mimic. Scale bar in migration: 200 μm. Scale bar in invasion: 100 μm. (e) The western blot assay was used to detect MMP2 and MMP9 expression in ESC with miR-106a-5p mimic transfected. β-actin was conducted as a loading control. (f) The quantification of MMP2 and MMP9 protein. One-way ANOVA. **p < 0.01, ns: not-significant
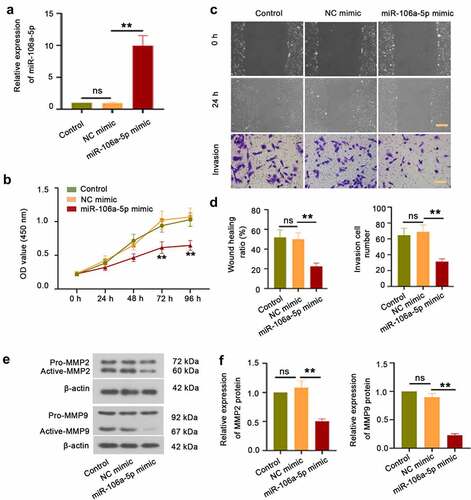
Figure 3. miR-106a-5p downregulated FOXC1 expression via targeting 3ʹUTR of FOXC1. (a) The sequence alignment of FOXC1 binding to miR-106a-5p. (b) Luciferase reporter assay was performed to evaluate the binding activity between FOXC1 and miR-106a-5p. One-way ANOVA. **p < 0.01. (c) The FOXC1 expression in ESCs with miR-106a-5p mimic transfected was examined using RT-qPCR. One-way ANOVA. **p < 0.01, ns: not-significant. (d, e) The detection and quantification of FOXC1, the p-PI3K, p-AKT, and p-mTOR in ESCs with miR-106a-5p mimic transfected using western blot assay. β-actin was conducted as a loading control. One-way ANOVA. **p < 0.01, ns: not-significant
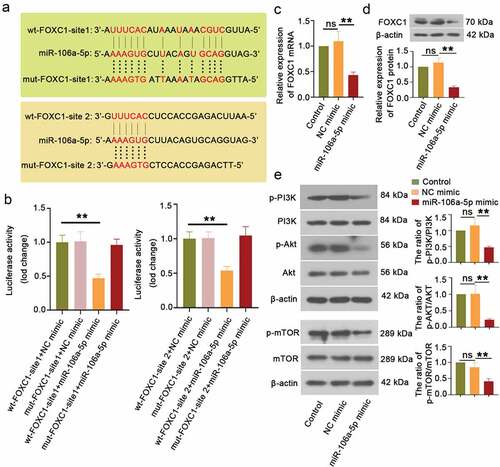
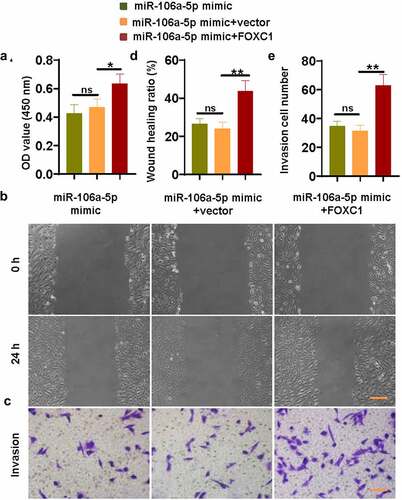
Figure 4. miR-106a-5p inhibited ESC proliferation, invasion, and migration via reducing FOXC1 expression. (a) The CCK-8 assay revealed that FOXC1 promoted the proliferation of ESCs which were suppressed by a miR-106a-5p mimic. (b) The down-regulated migration activity of ESCs caused by the miR-106a-5p mimic was activated by FOXC1. Scale bar: 200 μm. (c) The declined invasion activity of ESCs caused by the miR-106a-5p mimic was promoted by FOXC1. Scale bar: 100 μm. (d-e) The quantitative analysis of wound healing ratio and invasion cell number. One-way ANOVA. *p < 0.05, **p < 0.01, ns: not-significant
Supplemental Material
Download ()Data availability statement
The data used to support the findings in this study are available from the corresponding author upon request