
Figures & data
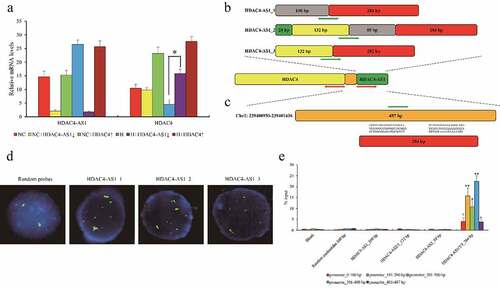
Figure 1. The RNA profiles of ARPE-19 cells treated by hypoxia. The phenotype of cell growth (a) and apoptosis (b) of cultured ARPE-19 cells under hypoxic and re-oxygenated conditions. The protein expression of HIF-1α, VEGFA and ANG1 in ARPE-19 cells (c). Heatmap of differential expressed genes of ARPE-19 cells (d). Color bars above the heatmap represent sample groups: red is for up-regulated genes and blue is for down-regulated genes. Gene ontology analysis including biological process, cellular component and molecular function and KEGG analysis (e) of the top 10 function enrichments or pathways associated with these differential expressed genes. NC means normoxic condition, H means hypoxic condition and RO means re-oxygenation. The comparison of H to NC (‘*’) and RO to H (‘#’) with the statistical significance that p value is less than 0.05. Data are presented as mean ± standard error of the mean of three individual experiments
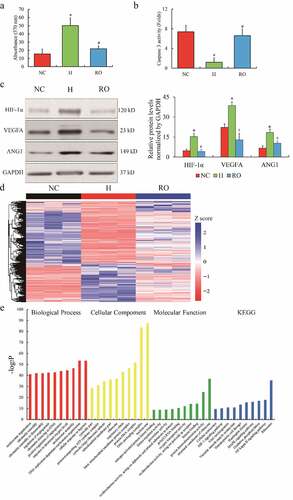
Figure 2. The interaction between HDAC4-AS1 and the promoter of HDAC4 in ARPE-19 cells. The expression of HDAC4 affected by silenced HDAC4-AS1 in ARPE-19 cells (a). The schematic diagram of different variants of HDAC4-AS1 (b). The putative binding sequence of HDAC4-AS1 to the shared promoter region of HDAC4/HDAC4-AS1 (c). Red arrows represent the transcription orientation. Green arrows represent the probes’ location. The interaction between HDAC4-AS1 and HDAC4 in hypoxic ARPE-19 cells shown by FISH assay (d). Green signals mean the transcripts of HDAC4-AS1, red signals mean the allelic target promoter region, and yellow signals mean the overlapped green and red signals. The interaction between HDAC4-AS1 and HDAC4 in hypoxic ARPE-19 cells shown by pull down assay (e). Data are presented as mean ± standard error of the mean of three individual experiments. NC means normoxic ARPE-19 cells, H means ARPE-19 cells cultured under only hypoxic condition, HDAC4-AS1↓ means HDAC4-AS1 knockdown, and HDAC4↑ means HDAC4 over-expression. ‘*’ and ‘**’ represent the statistical significance as p value is less than 0.05 or 0.01
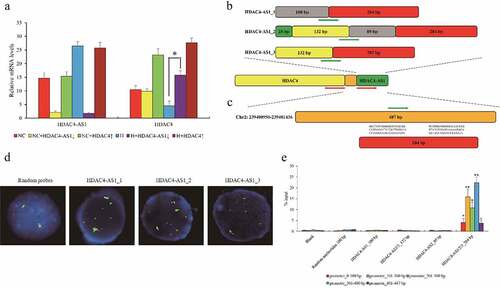
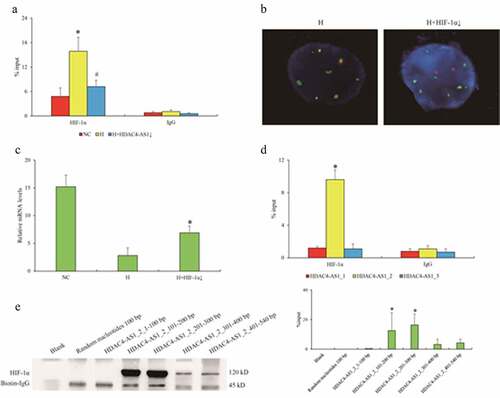
Figure 3. The interaction between HDAC4-AS1 and HIF-1α in ARPE-19 cells. Enrichment of HIF-1α on shared promoter of HDAC4/HDAC4-AS1 shown by ChIP-qPCR assay (a). The statistical significance by the comparison between H and NC (‘*’) as well as between H+ HDAC4-AS1 knockdown and H (‘#’), with p value less than 0.05. The interaction between HDAC4-AS1 and promoter region affected by HIF-1α knockdown shown by FISH assay (b). The HDAC4 transcription affected by HIF-1α knockdown (c). ‘*’ represents the statistical significance by the comparison between H + HIF-1α knockdown and H, with p value less than 0.05. The interaction between HIF-1α and different variants of HDAC4-AS1 (d). ‘*’ represents the statistical significance comparing HIF-1α with IgG in HDAC4-AS1_2 group. The detailed binding domain of HDAC4-AS1_2 interacted with HIF-1α shown by pull down and western blot assays (e). Data are presented as mean ± standard error of the mean of three individual experiments
Supplemental Material
Download ()Availability of data and materials
The datasets used and/or analyzed during the current study are available from the corresponding author upon reasonable request.