
Figures & data
Table 1. The sequences of primers used in qRT-PCR
Figure 1. The antifungal activity of phloretin on Candida albicans. (a) The minimal inhibitory concentration of phloretin that resulted in 80% suppression (MIC) of C. albicans growth. (b) Time-killing curves of C. albicans were measured by CFU counts in the presence of phloretin at 74.55, 149.10, or 298.20 μg/mL (the concentration equivalent to 1×, 2× or 4× MIC). *p < 0.05, **p < 0.01 versus Control
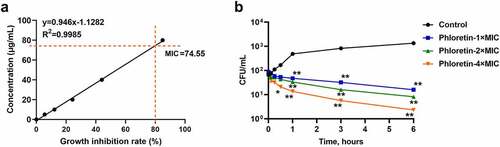
Figure 2. Phloretin inhibited the biofilm formation of Candida albicans. C. albicans (1 × 10⁵ CFU/mL) was treated with 37.28, 74.55, or 149.10 μg/mL (the concentration equivalent to 0.5×, 1× or 2× MIC) phloretin. (a) Calcofluor white staining of C. albicans. Scale bar = 200 μm (b) The membrane permeability of C. albicans was measured by the proportion of live/dead cells. (c) The metabolic activity of C. albicans biofilm exposed to phloretin treatment was evaluated by XTT assay. (d) The biofilm biomass of C. albicans was assessed by crystal-violet biofilm assay. *p < 0.05, **p < 0.01 versus Control
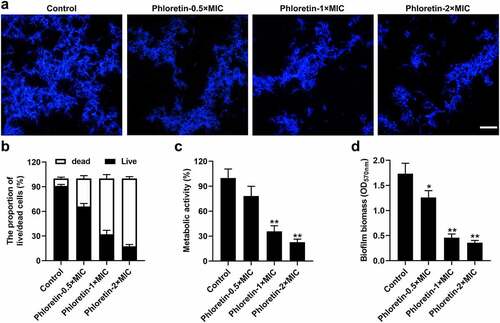
Figure 3. Phloretin suppressed the yeast-to-hyphae transition of Candida albicans. C. albicans (1 × 10⁶ CFU/mL) was treated with 37.28, 74.55, or 149.10 μg/mL (the concentration equivalent to 0.5×, 1× or 2× MIC) phloretin. (a) Representative images of the hyphal formation of C. albicans. Scale bar = 200 μm. The hyphae inhibition rate (%) = (the number of hyphaecontrol – the number of hyphaephloretin)/the number of hyphaecontrol×100%. (b-e) The relative expression of EAP1, ECE1, HWP1, and ALS3. *p < 0.05, **p < 0.01 versus Control
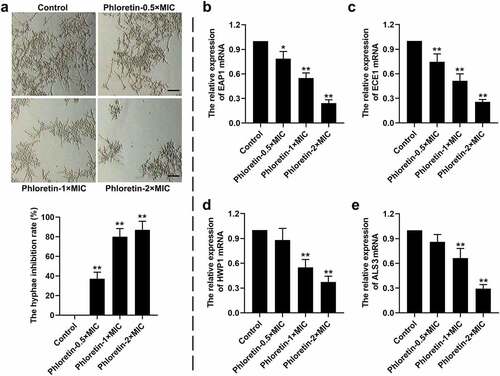
Figure 4. Phloretin attenuated the secretion of Candida albicans protease and phospholipase. C. albicans (1 × 10⁶ CFU/mL) was treated with 37.28, 74.55, or 149.10 μg/mL (the concentration equivalent to 0.5×, 1× or 2× MIC) phloretin. (a) The protease activity of C. albicans. (b) The phospholipase activity of C. albicans. (c-e) The mRNA level of SAP1, SAP2, and PLB1. *p < 0.05, **p < 0.01 versus Control
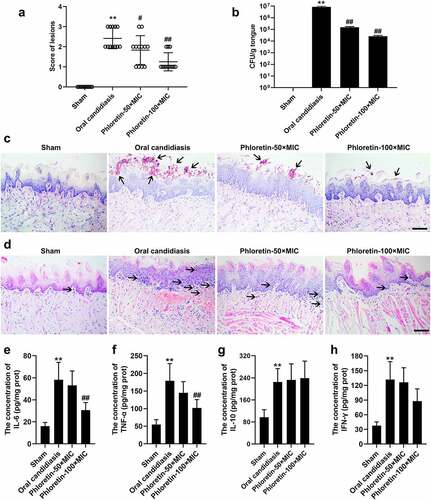
Figure 5. Phloretin ameliorated the fungal activity in the murine model of oral candidiasis. Mice were sublingually infected with C. albicans suspension (1 × 10⁷ CFU/mL) for 75 min. Topical treatments of phloretin (3.73 or 7.46 mg/mL, which were equivalent to 50× or 100× MIC) were applied twice a day starting on day one post-infection. (a) The score of lesions on the tongue tissues of mice for five days. (b) The CFU counts of C. albicans from the tongue tissues of mice with oral candidiasis. (c) The PAS staining of tongue tissues of mice. Arrows: C. albicans cells. Scale bar = 100 μm. (d) The H&E staining of tongue tissues of mice. Arrows: inflammatory cells. Scale bar = 100 μm. (e-h) The concentration of IL-6, TNF-α, IL-10, and IFN-γ. **p < 0.01 versus Sham; #p < 0.05, ##p < 0.01 versus Oral candidiasis
Data availability statement
The data that support the findings of this study are available from the corresponding author QL upon reasonable request.