
Figures & data
Table 1. Characteristics of the study subjects
Figure 1. The alpha diversity and beta diversity indices of the oral microbiota in migraine and control groups
(a) Differences in alpha diversity indices between migraine and healthy groups measured with Chao 1 index, observed species index, PD whole tree index, Shannon index and Simpson index. From bottom to top, each box plot represents the minimum, first quartile, median, third quartile and maximum values. (b) Differences in beta diversity indices between migraine and healthy groups measured with weighted and unweighted Adonis test and PCOA. The horizontal and vertical axes represent the first and second principal coordinates explaining the greatest proportion of variance to the bacterial communities (showed by percentage). MS: migraine sample group; CS: control sample group; OTU: operational taxonomic unit; PCOA: principal coordinates analysis.
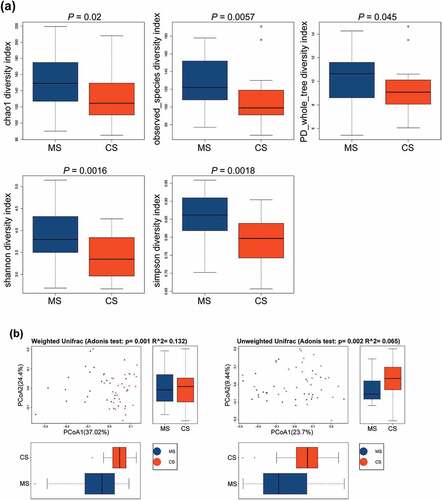
Figure 2. Relative abundances of the oral microbiota in migraine and control groups
Barplots showing relative abundances of the oral microbiota at the genus, family, order, class and phylum levels. MS: migraine sample group; CS: control sample group.
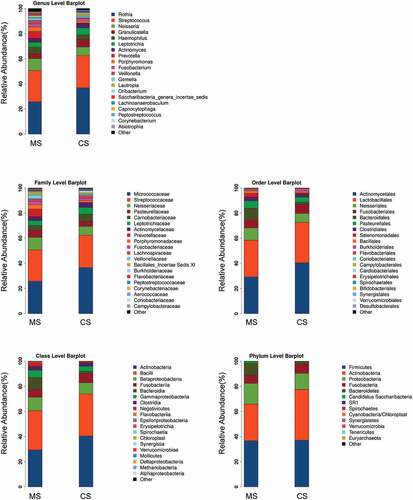
Figure 3. Taxonomic differences of the oral microbiota in migraine and control groups
(a) Clustering tree showing significant taxonomic differences in the oral microbiota between migraine (negative score) and control (positive score) groups through LEfSe analysis (LDA scores (log10) >2). (b) Cladogram indicating the phylogenetic distribution of the oral microbiota in migraine and control groups through LEfSe analysis (LDA scores (log10) >2). (c) The top 20 differentially abundant genera between migraine and control groups. MS: migraine sample group; CS: control sample group; p: phylum; c: class; o: order; f: family; g: genus; LEfSe: linear discriminant analysis effect size; LDA: linear discriminant analysis.
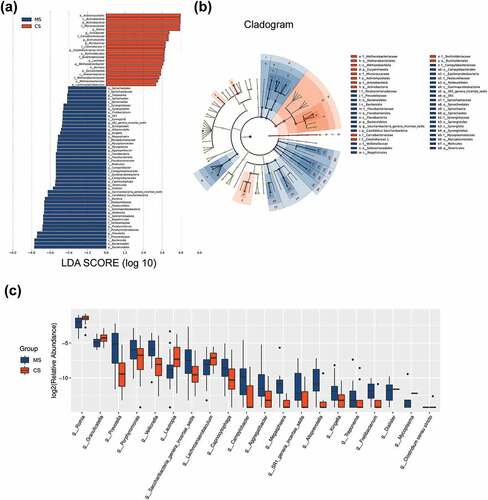
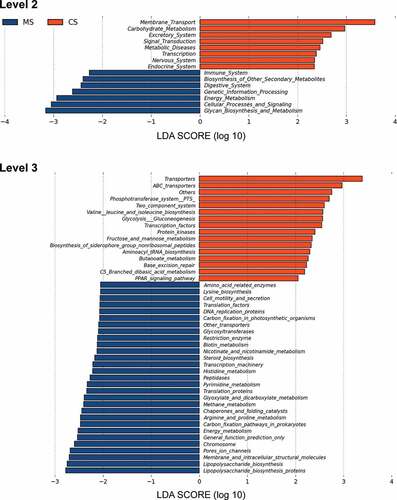
Figure 4. Functional predictions for the oral microbiota of migraine and control groups
Level 2 and 3 KEGG pathways significant for the oral microbiota of migraine (negative score) and control (positive score) groups identified using PICRUSt. MS: migraine sample group; CS: control sample group; KEGG: Kyoto Encyclopedia of Genes and Genomes; PICRUSt: Phylogenetic Investigation of Communities by Reconstruction of Unobserved States.
Supplemental material
Supplemental Material
Download ()Data Availability Statement
The datasets generated and/or analyzed during the current study are available in the [NCBI Sequence Read Archive] repository at [https://www.ncbi.nlm.nih.gov/Traces/study/?acc=PRJNA680860].