
Figures & data
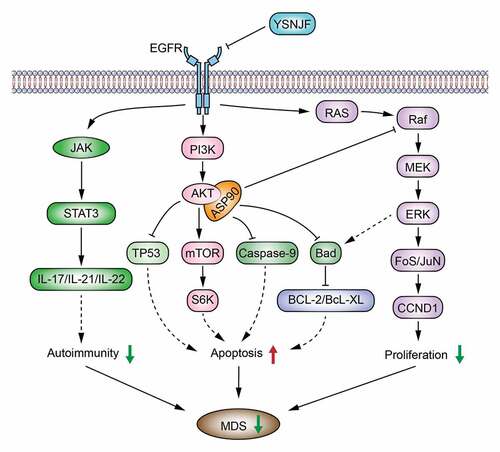
Table 1. Active compounds and corresponding potential therapeutic targets of YSNJF
Table 2. Intersected compound from multiple herbal medicines
Figure 1. Harvested 772 MDS-related targets from indicated databases
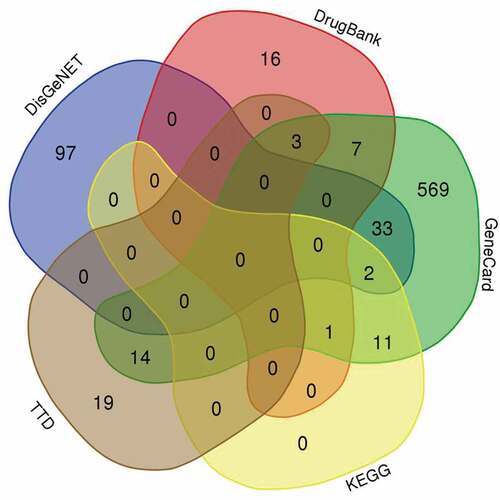
Table 3. List of major compounds corresponding to intersected targets
Figure 2. Venn plots show intersected targets between drug and disease
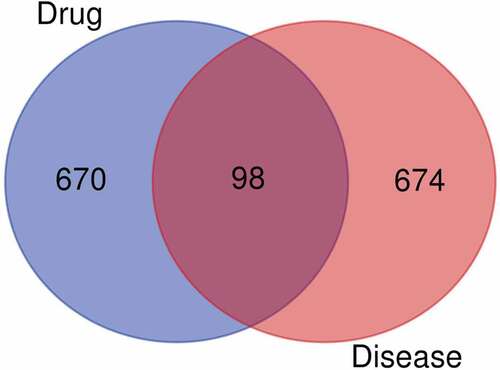
Figure 3. YSNJF-compounds-target-MDS network. Blue nodes represent drug and disease, respectively; red nodes represent active compounds; green nodes represent disease-related targets. Lines in the figure represent the interaction between two nodes
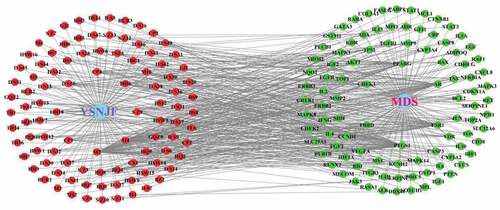
Figure 4. Protein–protein interaction (PPI) network of drug and disease intersected targets
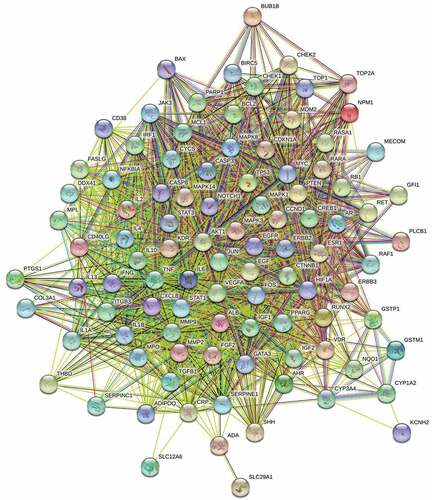
Figure 5. Protein–protein interaction (PPI) network of identified major targets. Light blue nodes were regular targets while yellow nodes were major targets
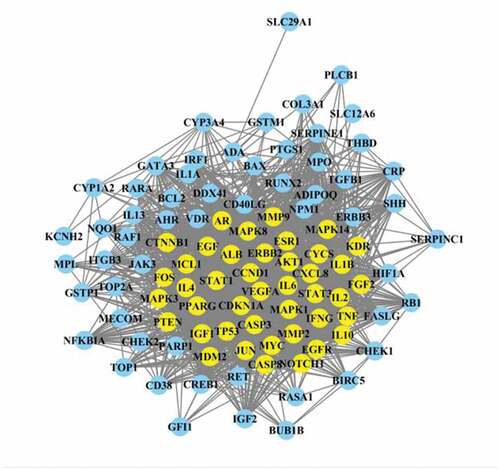
Figure 6. Protein–protein interaction (PPI) network of identified core targets. Light blue nodes were regular targets while yellow nodes were core targets
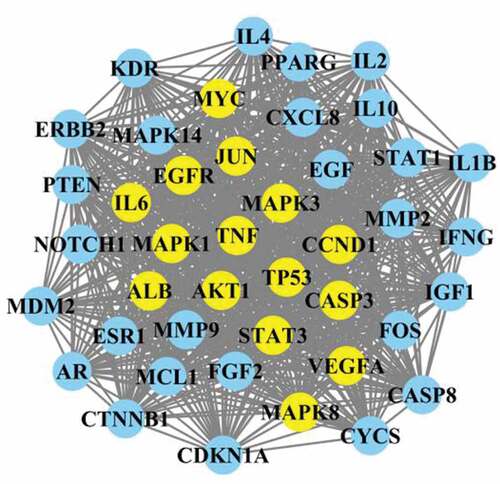
Figure 7. GO enrichment analysis of intersected targets between drug and disease. The top 20 GO terms in biological process (BP, A), cellular component (CC, B), molecular function (MF, C) with adjusted P value <0.05 were selected and present in a bubble chart manner. The size of bubble represents number of targets enriched in the indicated pathway and the color of the bubble represents the P value of enrichment
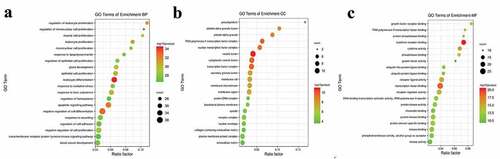
Figure 8. KEGG enrichment analysis of intersected targets between drug and disease. The top 20 KEGG pathways with adjusted P value <0.05 were selected and present in a bubble chart manner. The size of bubble represents the number of targets enriched in the indicated pathway and the color of the bubble represents the P value of enrichment
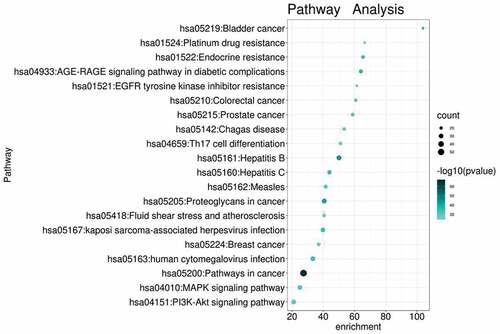
Figure 9. Representative signaling transduction of Pathways in cancer merged with identified targets. Genes in red are potential targets of YSNJF in treating MDS as predicted by network pharmacology
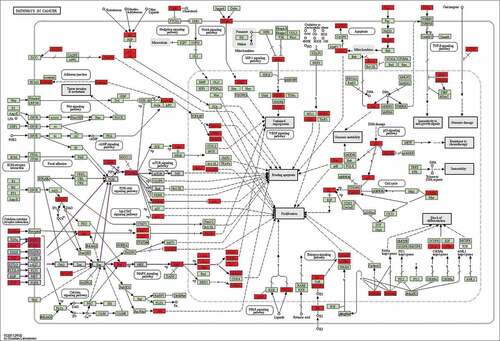
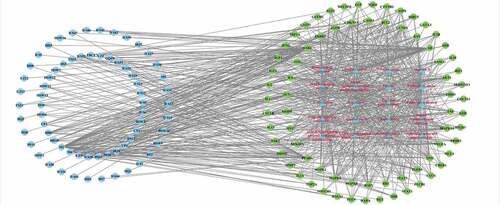
Figure 10. Compounds-targets-pathways network. Light blue nodes represent active compounds; red triangle nodes represent KEGG pathways; green nodes represent disease-related targets. Lines in the figure represent the interaction between two nodes
Data availability statement
The data related to this research can be obtained from the corresponding author upon reasonable request.