
Figures & data
Figure 1. Identification of the differentially expressed m6A-related lncRNAs with prognostic value in the cohort from TCGA. (a) Identification of m6A-related lncRNAs (b) Venn diagram to identify differentially expressed m6A-related lncRNAs between PAAD and normal pancreas tissues associated with prognosis. (c) Heatmap to explore mRNA levels of 57 differentially expressed m6A-related lncRNAs with prognostic values. (d) Univariate Cox regression analysis of 57 differentially expressed m6A-related lncRNAs with prognostic values
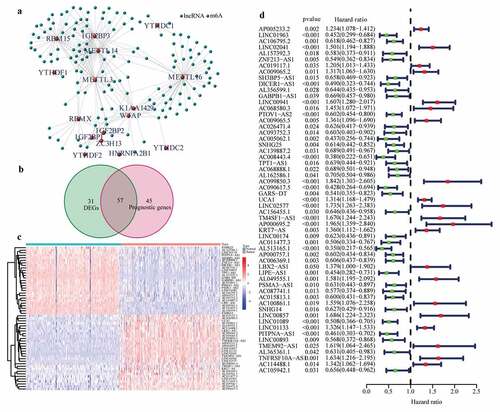
Figure 2. Prognostic performance of the m6A-LPS in the cohort from TCGA. (a) The distribution and median value of the risk scores in the cohort from TCGA. (b) PCA plot of the cohort from TCGA. (c) Distributions of OS status, OS and risk score in the cohort from TCGA. (d) Differential expression of five lncRNAs used for constructing m6A-LPS between high- and low-risk subgroups. (e) Kaplan-Meier curves for the OS of patients in the high- and low-risk groups in the cohort from TCGA. (f) AUC of the time-dependent ROC curve validated the prognostic value of the risk score in the cohort from TCGA
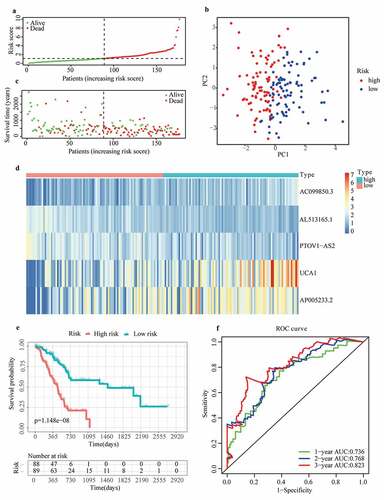
Figure 3. Prognostic performance of m6A-LPS in the cohort from ICGC. (a) The distribution and median value of the risk scores in the cohort from ICGC. (b) PCA plot of the cohort from ICGC. (c) Distributions of OS status, OS and risk score in the cohort from ICGC. (d) Differential expression of five lncRNAs used for constructing m6A-LPS between high- and low-risk subgroups. (e) Kaplan-Meier curves for the OS of patients in the high- and low-risk groups in the cohort from ICGC. (f) AUC of the time-dependent ROC curve validated the prognostic value of the risk score in the cohort from ICGC
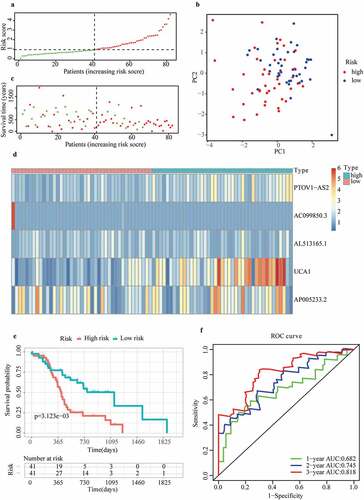
Figure 4. Discrepancy in risk scores between different subgroups: (a) Age, (b) Sex, (c) Race, (d) Stage, (e) Histological grade, (f) Neoplasm location, (g) Maximum tumor dimension, (h) Surgery type, (i) Resection margins, (j) Radiation therapy, (k) Cancer status, (l) Chronic pancreatitis history, (m) Diabetes history, (n) Drinking frequency, (o) Smoking type, (p) Family history of cancer
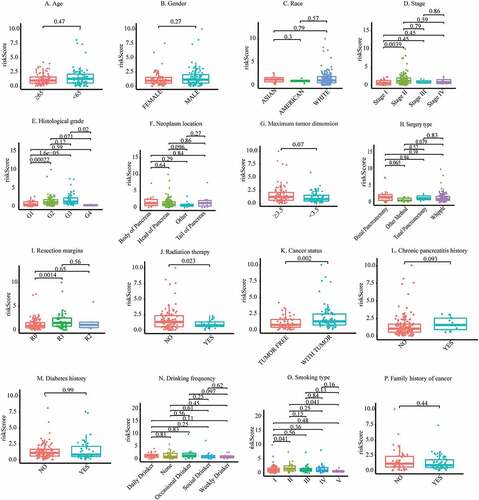
Figure 5. Co-expression status of m6A genes and their related lncRNAs and clinical significance. (a) Sankey plot to identify a one-to-one match between m6A genes and their related lncRNAs. (b) Circle plot for the correlation between m6A genes and their related lncRNAs. (c) Differential expression of m6A genes and their-related lncRNAs between stage I/II/III/IV patients. (d) Differential expression of m6A genes and their related lncRNAs between grade I/II/III/IV patients
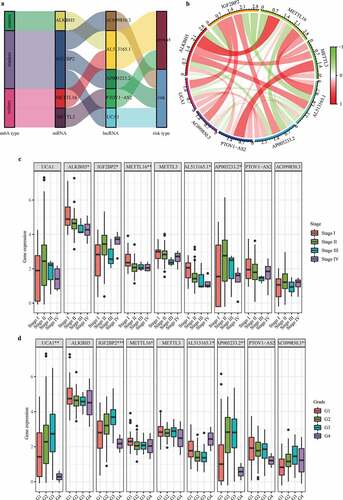
Figure 6. Independent prognostic analysis of the risk score acquired from m6A-LPS in the cohort from TCGA. (a) Univariate and (b) multivariate Cox regression analyses of the association between risk score, clinicopathological parameters and overall survival of patients in the cohort from TCGA. (c) Nomogram composed of grade, cancer status and risk score for the prediction of 0.5-, 1-, and 2-year OS probability. (d) Calibration plot for the evaluation of the nomogram in predicting 0.5-year, 1-year, and 2-year OS probability
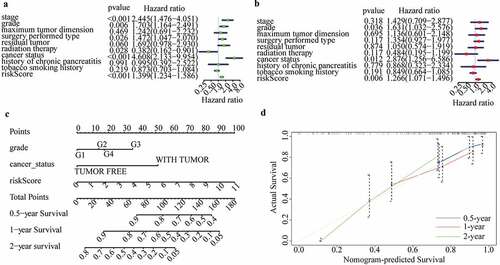
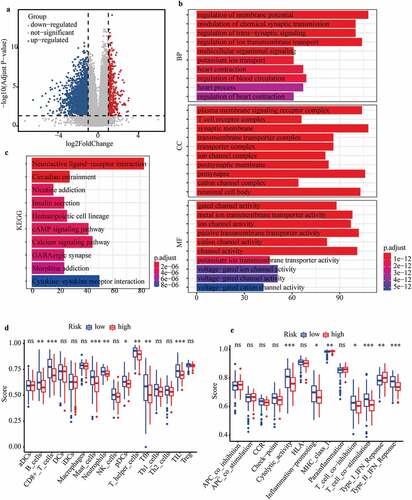
Figure 7. Investigation of cellular processes, signaling pathways, and immune status affected by m6A-LPS. (a) Volcano plot of DEGs between high- and low-risk groups. (b) GO enrichment and (c) KEGG pathway analysis of DEGs between high- and low-risk groups. Comparison of ssGSEA scores between different risk subgroups. The scores for (d) 16 immune cells and (e) 13 immune-related functions are displayed in boxplots
Availability of data and materials
The datasets analysed during the current study are publicly available on the TCGA (https://cancergenome.nih.gov/), GTEx (https://www.gtexportal.org/home/) and ICGC (https://dcc.icgc.org/) databases. The data that support the findings of this study are also available from the first author (Qihang Yuan) upon reasonable request.